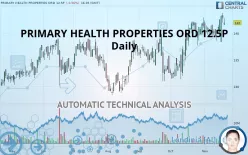
PRIMARY HEALTH PROPERTIES ORD 12.5P - Daily - Technical analysis published on 11/20/2019 (GMT)
- 360
- 0
- Who voted?
Click here for a new analysis!
- Timeframe : Daily
- - Analysis generated on
- Status : TARGET REACHED

Summary of the analysis

Additional analysis
Quotes
The PRIMARY HEALTH PROPERTIES ORD 12.5P rating is 142.0 GBX. The price registered a decrease of -0.56% on the session and was between 141.6 GBX and 142.8 GBX. This implies that the price is at +0.28% from its lowest and at -0.56% from its highest.The Central Gaps scanner detects a bearish gap which is a sign that the sellers have taken the lead in the very short term.
Opening Gap DOWN
Type : Bearish
Timeframe : Openning
A study of price movements over other periods shows the following variations:
New HIGH record (5 years)
Type : Bullish
Timeframe : Weekly
Near a new HIGH record (1st january)
Type : Bullish
Timeframe : Weekly
Technical
Technical analysis of PRIMARY HEALTH PROPERTIES ORD 12.5P in Daily shows a strongly overall bullish trend. The signals given by the moving averages are 92.86% bullish. This strong bullish trend is confirmed by the strong signals currently being given by short-term moving averages. The Central Indicators scanner does not detect any result on moving averages that would impact this trend.
In fact, 11 technical indicators on 18 studied are currently bullish. Caution: the Central Indicators scanner currently detects an excess:
CCI indicator is overbought : over 100
Type : Neutral
Timeframe : Daily
Previous candle closed over Bollinger bands
Type : Neutral
Timeframe : Daily
RSI indicator: bearish divergence
Type : Bearish
Timeframe : Daily
Williams %R indicator is overbought : over -20
Type : Neutral
Timeframe : Daily
MACD crosses UP its Moving Average
Type : Bullish
Timeframe : Daily
Aroon indicator bullish trend
Type : Bullish
Timeframe : Daily
Price is back over the pivot point
Type : Bullish
Timeframe : Weekly
Price is back under the pivot point
Type : Bearish
Timeframe : Daily
Central Patterns, the market scanner focusing on chart patterns, resistances and supports found this result:
Near horizontal support
Type : Bullish
Timeframe : Daily
No result was found by the Central Candlesticks scanner on Japanese candlesticks.
| S3 | S2 | S1 | Price | |
|---|---|---|---|---|
| ProTrendLines | 132.8 | 138.9 | 141.8 | 142.0 |
| Change (%) | -6.48% | -2.18% | -0.14% | - |
| Change | -9.2 | -3.1 | -0.2 | - |
| Level | Intermediate | Major | Major | - |
Attention could also be paid to pivot points to set price objectives:
| Pivot points | S3 | S2 | S1 | PP | R1 | R2 | R3 |
|---|---|---|---|---|---|---|---|
| Standard | 140.1 | 141.1 | 141.9 | 142.9 | 143.7 | 144.7 | 145.5 |
| Camarilla | 142.3 | 142.5 | 142.6 | 142.8 | 143.0 | 143.1 | 143.3 |
| Woodie | 140.1 | 141.1 | 141.9 | 142.9 | 143.7 | 144.7 | 145.5 |
| Fibonacci | 141.1 | 141.8 | 142.2 | 142.9 | 143.6 | 144.0 | 144.7 |
| Pivot points | S3 | S2 | S1 | PP | R1 | R2 | R3 |
|---|---|---|---|---|---|---|---|
| Standard | 135.9 | 137.3 | 139.9 | 141.3 | 143.9 | 145.3 | 147.9 |
| Camarilla | 141.5 | 141.9 | 142.2 | 142.6 | 143.0 | 143.3 | 143.7 |
| Woodie | 136.6 | 137.6 | 140.6 | 141.6 | 144.6 | 145.6 | 148.6 |
| Fibonacci | 137.3 | 138.8 | 139.7 | 141.3 | 142.8 | 143.7 | 145.3 |
| Pivot points | S3 | S2 | S1 | PP | R1 | R2 | R3 |
|---|---|---|---|---|---|---|---|
| Standard | 120.2 | 125.1 | 133.2 | 138.1 | 146.3 | 151.1 | 159.3 |
| Camarilla | 137.8 | 139.0 | 140.2 | 141.4 | 142.6 | 143.8 | 145.0 |
| Woodie | 121.9 | 125.9 | 134.9 | 138.9 | 147.9 | 152.0 | 160.9 |
| Fibonacci | 125.1 | 130.1 | 133.1 | 138.1 | 143.1 | 146.2 | 151.1 |
Numerical data
The following are the details of the technical indicators and moving averages that were collected to generate this technical analysis:
| RSI (14): | 59.20 | |
| MACD (12,26,9): | 1.3000 | |
| Directional Movement: | 2.8 | |
| AROON (14): | 7.2 | |
| DEMA (21): | 142.5 | |
| Parabolic SAR (0,02-0,02-0,2): | 138.4 | |
| Elder Ray (13): | 0.8 | |
| Super Trend (3,10): | 136.3 | |
| Zig ZAG (10): | 142.0 | |
| VORTEX (21): | 1.0000 | |
| Stochastique (14,3,5): | 81.40 | |
| TEMA (21): | 142.5 | |
| Williams %R (14): | -33.30 | |
| Chande Momentum Oscillator (20): | 1.6 | |
| Repulse (5,40,3): | 2.5000 | |
| ROCnROLL: | 1 | |
| TRIX (15,9): | 0.1000 | |
| Courbe Coppock: | 1.30 |
| MA7: | 141.7 | |
| MA20: | 141.0 | |
| MA50: | 137.4 | |
| MA100: | 135.2 | |
| MAexp7: | 141.9 | |
| MAexp20: | 140.8 | |
| MAexp50: | 138.3 | |
| MAexp100: | 135.5 | |
| Price / MA7: | +0.21% | |
| Price / MA20: | +0.71% | |
| Price / MA50: | +3.35% | |
| Price / MA100: | +5.03% | |
| Price / MAexp7: | +0.07% | |
| Price / MAexp20: | +0.85% | |
| Price / MAexp50: | +2.68% | |
| Price / MAexp100: | +4.80% |
News
Don"t forget to follow the news on PRIMARY HEALTH PROPERTIES ORD 12.5P. At the time of publication of this analysis, the latest news was as follows:
-
 Primary Health Properties delivering 'impressive dividend track record and steady capital gains'
- Hardman & Co Research: Primary Health Properties (PHP): High security and accelerating dividend growth
- Edison issues outlook on Primary Health Properties (PHP)
- Hardman & Co Research: Primary Health Properties (PHP): Step change, with MedicX Fund merger
- Sandell Asset Management Europe Limited : Form 8.3 - Primary Health Properties plc
About author

Online


Add a comment
Comments
0 comments on the analysis PRIMARY HEALTH PROPERTIES ORD 12.5P - Daily