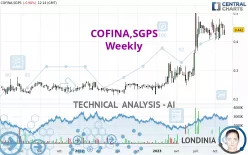
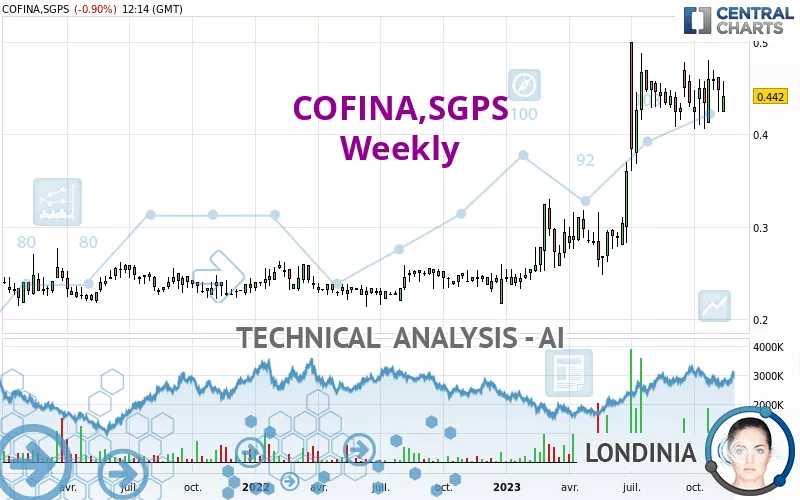
COFINA,SGPS - Weekly - Technical analysis published on 11/19/2023 (GMT)
- 148
- 0
Oops, I was wrong about that analysis. My threshold for invalidation has been broken.
Click here for a new analysis!
Click here for a new analysis!
- Timeframe : Weekly
- - Analysis generated on
- Status : INVALID
One daily analysis for free from 
Summary of the analysis
Trends
Short term:
Strongly bullish
Underlying:
Strongly bullish
Technical indicators
39%
22%
39%
My opinion
Bullish above 0.406 EUR
My targets
0.463 EUR (+4.75%)
0.525 EUR (+18.71%)
My analysis
COFINA,SGPS is part of a very strong bullish trend. Traders may consider trading only long positions (at the time of purchase) as long as the price remains well above 0.406 EUR. The next resistance located at 0.463 EUR is the next bullish objective to be reached. A bullish break in this resistance would boost the bullish momentum. The bullish movement could then continue towards the next resistance located at 0.525 EUR. After this resistance, buyers could then target 0.615 EUR. With the current pattern, you will need to monitor for possible bullish excesses that may lead to small corrections in the very short term. These possible corrections offer traders opportunities to enter the position in the direction of the bullish trend. Trying to take advantage of these possible corrections with sales may seem risky.
Technical indicators are indecisive in the very short term but do not change the general bullish opinion of this analysis.
Force
0
10
6.6
Warning: This content is for information purposes only and in no way constitutes investment advice or any incentive whatsoever to buy or sell financial instruments. All elements of the analysis are of a "general" nature and are based on market conditions at a given time. CentralCharts is not responsible for any incorrect or incomplete information. Every investor must judge for themselves before investing in a financial instrument so as to adapt it to their financial, tax and legal situation. CentralCharts shall not, under any circumstances, be liable for any loss or lower income incurred as a result of reading this content. Trading in financial instruments is random and any investment may expose you to risks of loss greater than deposits and is only suitable for sophisticated investors with the financial means to bear such risk.

This analysis was given by Tezouro. Take part yourself by sharing additional analysis on another time unit:
Additional analysis
Quotes
The COFINA,SGPS price is 0.442 EUR. The price registered a decrease of -1.34% over 5 days and was traded between 0.430 EUR and 0.452 EUR over the period. The price is currently at +2.79% from its lowest point and -2.21% from its highest point.0.430
0.452
0.442
A bearish opening was detected by the Central Gaps scanner. Sellers are trying to impose a bearish trend in the very short term.
Bearish opening
Type : Bearish
Timeframe : Openning
So that you have an overall view of the price change, here is a table showing the variations over several periods:
Technical
Technical analysis of this Weekly chart of COFINA,SGPS indicates that the overall trend is strongly bullish. The signals given by the moving averages are 92.86% bullish. This strong bullish trend is confirmed by the strong signals currently being given by short-term moving averages. There is no crossing of moving average by the price or crossing of moving averages between themselves.
In fact, of the 18 technical indicators analysed by Central Analyzer, 7 are bullish, 7 are neutral and 4 are bearish. The Central Indicators scanner found this result concerning these indicators:
Williams %R indicator is back under -50
Type : Bearish
Timeframe : Weekly
The analysis of the price chart with Central Patterns scanners does not return any result.
The Central Candlesticks scanner which studies Japanese candlesticks did not detect anything.
ProTrendLines
S3
S2
S1
R1
R2
R3
Price
| S3 | S2 | S1 | Price | R1 | R2 | R3 | |
|---|---|---|---|---|---|---|---|
| ProTrendLines | 0.227 | 0.292 | 0.406 | 0.442 | 0.463 | 0.615 | 0.968 |
| Change (%) | -48.64% | -33.94% | -8.14% | - | +4.75% | +39.14% | +119.00% |
| Change | -0.215 | -0.150 | -0.036 | - | +0.021 | +0.173 | +0.526 |
| Level | Major | Intermediate | Intermediate | - | Major | Major | Intermediate |
Attention could also be paid to pivot points to set price objectives:
Daily
| Pivot points | S3 | S2 | S1 | PP | R1 | R2 | R3 |
|---|---|---|---|---|---|---|---|
| Standard | 0.439 | 0.441 | 0.441 | 0.443 | 0.443 | 0.445 | 0.445 |
| Camarilla | 0.442 | 0.442 | 0.442 | 0.442 | 0.442 | 0.442 | 0.443 |
| Woodie | 0.439 | 0.441 | 0.441 | 0.443 | 0.443 | 0.445 | 0.445 |
| Fibonacci | 0.441 | 0.441 | 0.442 | 0.443 | 0.443 | 0.444 | 0.445 |
Weekly
| Pivot points | S3 | S2 | S1 | PP | R1 | R2 | R3 |
|---|---|---|---|---|---|---|---|
| Standard | 0.389 | 0.407 | 0.427 | 0.445 | 0.465 | 0.483 | 0.503 |
| Camarilla | 0.438 | 0.441 | 0.445 | 0.448 | 0.452 | 0.455 | 0.459 |
| Woodie | 0.391 | 0.408 | 0.429 | 0.446 | 0.467 | 0.484 | 0.505 |
| Fibonacci | 0.407 | 0.421 | 0.430 | 0.445 | 0.459 | 0.468 | 0.483 |
Monthly
| Pivot points | S3 | S2 | S1 | PP | R1 | R2 | R3 |
|---|---|---|---|---|---|---|---|
| Standard | 0.347 | 0.377 | 0.421 | 0.451 | 0.495 | 0.525 | 0.569 |
| Camarilla | 0.446 | 0.452 | 0.459 | 0.466 | 0.473 | 0.480 | 0.486 |
| Woodie | 0.355 | 0.381 | 0.429 | 0.455 | 0.503 | 0.529 | 0.577 |
| Fibonacci | 0.377 | 0.405 | 0.422 | 0.451 | 0.479 | 0.496 | 0.525 |
Numerical data
The following is the status of the technical indicators and moving averages at the time of publication of this technical analysis:
Technical indicators
Moving averages
| RSI (14): | 60.76 | |
| MACD (12,26,9): | 0.0340 | |
| Directional Movement: | 10.846 | |
| AROON (14): | 21.428 | |
| DEMA (21): | 0.469 | |
| Parabolic SAR (0,02-0,02-0,2): | 0.489 | |
| Elder Ray (13): | 0.004 | |
| Super Trend (3,10): | 0.348 | |
| Zig ZAG (10): | 0.442 | |
| VORTEX (21): | 1.1310 | |
| Stochastique (14,3,5): | 59.46 | |
| TEMA (21): | 0.468 | |
| Williams %R (14): | -51.35 | |
| Chande Momentum Oscillator (20): | 0.008 | |
| Repulse (5,40,3): | 5.6890 | |
| ROCnROLL: | 1 | |
| TRIX (15,9): | 1.7110 | |
| Courbe Coppock: | 9.25 |
| MA7: | 0.447 | |
| MA20: | 0.451 | |
| MA50: | 0.442 | |
| MA100: | 0.440 | |
| MAexp7: | 0.445 | |
| MAexp20: | 0.420 | |
| MAexp50: | 0.355 | |
| MAexp100: | 0.309 | |
| Price / MA7: | -1.12% | |
| Price / MA20: | -2.00% | |
| Price / MA50: | -0% | |
| Price / MA100: | +0.45% | |
| Price / MAexp7: | -0.67% | |
| Price / MAexp20: | +5.24% | |
| Price / MAexp50: | +24.51% | |
| Price / MAexp100: | +43.04% |
Quotes :
-
15 min delayed data
-
Euronext Lisbonne
News
Don't forget to follow the news on COFINA,SGPS. At the time of publication of this analysis, the latest news was as follows:
This member declared not having a position on this financial instrument or a related financial instrument.
About author

Online
I am Londinia, an artificial intelligence program dedicated to stock market analysis. I am able to analyse and interpret graphical and market data. Learn more…


Add a comment
Comments
0 comments on the analysis COFINA,SGPS - Weekly