QRF - Daily - Technical analysis published on 04/29/2024 (GMT)
- 108
- 0
Click here for a new analysis!
- Timeframe : Daily
- - Analysis generated on
- Status : INVALID
Summary of the analysis

Additional analysis
Quotes
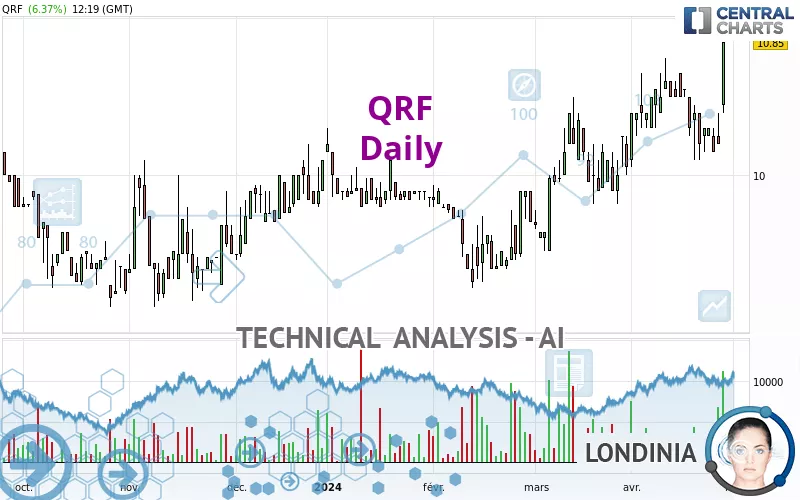
QRF rating 10.85 EUR. On the day, this instrument gained +6.37% and was between 10.40 EUR and 10.85 EUR. This implies that the price is at +4.33% from its lowest and at 0% from its highest.A bullish gap was detected at the opening by the Central Gaps scanner. There are a lot of buyers and they have the upper hand in the very short term.
Opening Gap UP
Type : Bullish
Timeframe : Openning
A study of price movements over other periods shows the following variations:
New HIGH record (1 year)
Type : Bullish
Timeframe : Weekly
New HIGH record (1st january)
Type : Bullish
Timeframe : Weekly
New HIGH record (1 month)
Type : Bullish
Timeframe : Weekly
Technical
Technical analysis of this Daily chart of QRF indicates that the overall trend is strongly bullish. 92.86% of the signals given by moving averages are bullish. The overall trend is supported by the strong bullish signals from short-term moving averages. The Central Indicators scanner detects a bullish signal on moving averages that could impact this trend:
Bullish price crossover with Moving Average 20
Type : Bullish
Timeframe : Daily
In fact, according to the parameters integrated into the Central Analyzer system, 13 technical indicators out of 18 analysed are currently bullish. But beware of excesses. The Central Indicators scanner currently detects this:
CCI indicator is overbought : over 100
Type : Neutral
Timeframe : Daily
Williams %R indicator is overbought : over -20
Type : Neutral
Timeframe : Daily
Pivot points : price is over resistance 3
Type : Neutral
Timeframe : Daily
Pivot points : price is over resistance 3
Type : Neutral
Timeframe : Weekly
RSI indicator is back over 50
Type : Bullish
Timeframe : Daily
Parabolic SAR indicator bullish reversal
Type : Bullish
Timeframe : Daily
Aroon indicator bullish trend
Type : Bullish
Timeframe : Daily
Momentum indicator is back over 0
Type : Bullish
Timeframe : Daily
Central Patterns, the market scanner focusing on chart patterns, resistances and supports found these results:
Near resistance of channel
Type : Bearish
Timeframe : Daily
Horizontal resistance is broken
Type : Bullish
Timeframe : Daily
The Central Candlesticks scanner, specialised in Japanese candlesticks, did not identify any signals.
| S3 | S2 | S1 | Price | R1 | R2 | R3 | |
|---|---|---|---|---|---|---|---|
| ProTrendLines | 10.40 | 10.60 | 10.76 | 10.85 | 11.55 | 13.53 | 15.14 |
| Change (%) | -4.15% | -2.30% | -0.83% | - | +6.45% | +24.70% | +39.54% |
| Change | -0.45 | -0.25 | -0.09 | - | +0.70 | +2.68 | +4.29 |
| Level | Minor | Major | Major | - | Minor | Minor | Minor |
Attention could also be paid to pivot points to set price objectives:
| Pivot points | S3 | S2 | S1 | PP | R1 | R2 | R3 |
|---|---|---|---|---|---|---|---|
| Standard | 9.93 | 10.07 | 10.13 | 10.27 | 10.33 | 10.47 | 10.53 |
| Camarilla | 10.15 | 10.16 | 10.18 | 10.20 | 10.22 | 10.24 | 10.26 |
| Woodie | 9.90 | 10.05 | 10.10 | 10.25 | 10.30 | 10.45 | 10.50 |
| Fibonacci | 10.07 | 10.14 | 10.19 | 10.27 | 10.34 | 10.39 | 10.47 |
| Pivot points | S3 | S2 | S1 | PP | R1 | R2 | R3 |
|---|---|---|---|---|---|---|---|
| Standard | 9.77 | 9.93 | 10.07 | 10.23 | 10.37 | 10.53 | 10.67 |
| Camarilla | 10.12 | 10.15 | 10.17 | 10.20 | 10.23 | 10.26 | 10.28 |
| Woodie | 9.75 | 9.93 | 10.05 | 10.23 | 10.35 | 10.53 | 10.65 |
| Fibonacci | 9.93 | 10.05 | 10.12 | 10.23 | 10.35 | 10.42 | 10.53 |
| Pivot points | S3 | S2 | S1 | PP | R1 | R2 | R3 |
|---|---|---|---|---|---|---|---|
| Standard | 8.57 | 9.04 | 9.55 | 10.02 | 10.53 | 11.00 | 11.51 |
| Camarilla | 9.78 | 9.87 | 9.96 | 10.05 | 10.14 | 10.23 | 10.32 |
| Woodie | 8.58 | 9.05 | 9.56 | 10.03 | 10.54 | 11.01 | 11.52 |
| Fibonacci | 9.04 | 9.42 | 9.65 | 10.02 | 10.40 | 10.63 | 11.00 |
Numerical data
The following is the status of the technical indicators and moving averages at the time of publication of this technical analysis:
| RSI (14): | 64.77 | |
| MACD (12,26,9): | 0.0800 | |
| Directional Movement: | 14.66 | |
| AROON (14): | 42.86 | |
| DEMA (21): | 10.47 | |
| Parabolic SAR (0,02-0,02-0,2): | 10.10 | |
| Elder Ray (13): | 0.24 | |
| Super Trend (3,10): | 9.95 | |
| Zig ZAG (10): | 10.85 | |
| VORTEX (21): | 1.0000 | |
| Stochastique (14,3,5): | 41.03 | |
| TEMA (21): | 10.44 | |
| Williams %R (14): | 0.00 | |
| Chande Momentum Oscillator (20): | 0.25 | |
| Repulse (5,40,3): | 3.5800 | |
| ROCnROLL: | 1 | |
| TRIX (15,9): | 0.1300 | |
| Courbe Coppock: | 1.21 |
| MA7: | 10.34 | |
| MA20: | 10.43 | |
| MA50: | 10.10 | |
| MA100: | 9.97 | |
| MAexp7: | 10.42 | |
| MAexp20: | 10.35 | |
| MAexp50: | 10.18 | |
| MAexp100: | 10.03 | |
| Price / MA7: | +4.93% | |
| Price / MA20: | +4.03% | |
| Price / MA50: | +7.43% | |
| Price / MA100: | +8.83% | |
| Price / MAexp7: | +4.13% | |
| Price / MAexp20: | +4.83% | |
| Price / MAexp50: | +6.58% | |
| Price / MAexp100: | +8.18% |
About author
Online


Add a comment
Comments
0 comments on the analysis QRF - Daily