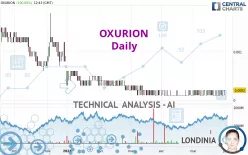
OXURION - Daily - Technical analysis published on 05/31/2024 (GMT)
- 110
- 0
- Timeframe : Daily
- - Analysis generated on
- Status : NEUTRAL

Summary of the analysis
Additional analysis
Quotes
The OXURION price is 0.0002 EUR. The price registered an increase of +100.00% on the session with the lowest point at 0.0001 EUR and the highest point at 0.0002 EUR. The deviation from the price is +100.00% for the low point and 0% for the high point.A bullish opening was detected by the Central Gaps scanner. Buyers are trying to impose a bullish momentum in the very short term.
Bullish opening
Type : Bullish
Timeframe : Openning
A study of price movements over other periods shows the following variations:
New LOW record (5 years)
Type : Bearish
Timeframe : Weekly
New LOW record (1 year)
Type : Bearish
Timeframe : Weekly
New LOW record (1st january)
Type : Bearish
Timeframe : Weekly
The Central Volumes scanner notes the presence of abnormal volumes:
Abnormal volumes
Timeframe : 50 days
Technical
A technical analysis in Daily of this OXURION chart shows a neutral trend. This indecision could turn into a bullish trend due to the bullish signals currently being given by short-term moving averages. An assessment of moving averages reveals several bullish signals that could impact this trend:
Bullish price crossover with Moving Average 20
Type : Bullish
Timeframe : Daily
Bullish price crossover with Moving Average 50
Type : Bullish
Timeframe : Daily
Bullish price crossover with adaptative moving average 20
Type : Bullish
Timeframe : Daily
In fact, only 9 technical indicators out of 18 studied are currently positioned bullish. Caution: the Central Indicators scanner currently detects an excess:
CCI indicator is overbought : over 100
Type : Neutral
Timeframe : Daily
MACD indicator: bullish divergence
Type : Bullish
Timeframe : Daily
Williams %R indicator is overbought : over -20
Type : Neutral
Timeframe : Daily
Pivot points : price is over resistance 1
Type : Neutral
Timeframe : Daily
Pivot points : price is over resistance 1
Type : Neutral
Timeframe : Weekly
RSI indicator is back over 50
Type : Bullish
Timeframe : Daily
MACD crosses UP its Moving Average
Type : Bullish
Timeframe : Daily
MACD indicator is back over 0
Type : Bullish
Timeframe : Daily
Momentum indicator is back over 0
Type : Bullish
Timeframe : Daily
The Central Patterns scanner, which studies chart patterns, resistances and supports, has identified this signal:
Near horizontal resistance
Type : Bearish
Timeframe : Daily
The Central Candlesticks scanner currently notes the presence of this pattern in Japanese candlesticks that could mark the end of the short-term trend currently underway:
Doji
Type : Neutral
Timeframe : Daily
| Price | R1 | R2 | R3 | |
|---|---|---|---|---|
| ProTrendLines | 0.0002 | 0.0003 | 0.0013 | 0.0022 |
| Change (%) | - | +50.00% | +550.00% | +1,000.00% |
| Change | - | +0.0001 | +0.0011 | +0.0020 |
| Level | - | Minor | Major | Minor |
Attention could also be paid to pivot points to set price objectives:
| Pivot points | S3 | S2 | S1 | PP | R1 | R2 | R3 |
|---|---|---|---|---|---|---|---|
| Standard | 0.0000 | 0.0000 | 0.0001 | 0.0001 | 0.0002 | 0.0002 | 0.0003 |
| Camarilla | 0.0001 | 0.0001 | 0.0001 | 0.0001 | 0.0001 | 0.0001 | 0.0001 |
| Woodie | -0.0001 | 0.0000 | 0.0001 | 0.0001 | 0.0002 | 0.0002 | 0.0003 |
| Fibonacci | 0.0000 | 0.0001 | 0.0001 | 0.0001 | 0.0002 | 0.0002 | 0.0002 |
Numerical data
The following is the status of the technical indicators and moving averages at the time of publication of this technical analysis:
| RSI (14): | 58.06 | |
| MACD (12,26,9): | 0.0000 | |
| Directional Movement: | 5.1407 | |
| AROON (14): | 0 | |
| DEMA (21): | 0.0001 | |
| Parabolic SAR (0,02-0,02-0,2): | 0.0001 | |
| Elder Ray (13): | 0.0001 | |
| Super Trend (3,10): | 0.0002 | |
| Zig ZAG (10): | 0.0002 | |
| VORTEX (21): | 1.0000 | |
| Stochastique (14,3,5): | 33.33 | |
| TEMA (21): | 0.0001 | |
| Williams %R (14): | 0.00 | |
| Chande Momentum Oscillator (20): | 0.0001 | |
| Repulse (5,40,3): | -122.3757 | |
| ROCnROLL: | 1 | |
| TRIX (15,9): | 0.0061 | |
| Courbe Coppock: | 5.45 |
| MA7: | 0.0001 | |
| MA20: | 0.0001 | |
| MA50: | 0.0001 | |
| MA100: | 0.0002 | |
| MAexp7: | 0.0001 | |
| MAexp20: | 0.0001 | |
| MAexp50: | 0.0002 | |
| MAexp100: | 0.0004 | |
| Price / MA7: | +100.00% | |
| Price / MA20: | +100.00% | |
| Price / MA50: | +100.00% | |
| Price / MA100: | -0% | |
| Price / MAexp7: | +100.00% | |
| Price / MAexp20: | +100.00% | |
| Price / MAexp50: | -0% | |
| Price / MAexp100: | -50.00% |
News
Don't forget to follow the news on OXURION. At the time of publication of this analysis, the latest news was as follows:
- Oxurion Receives Transparency Notification from Atlas Special Opportunities LLC
- Oxurion Announces Results on the Annual Shareholders’ Meeting of 16 May 2024
- Information on the Total Number of Voting Rights (Denominator) following Conversion Notice from Atlas
- Oxurion Receives Transparency Notification from Atlas Special Opportunities LLC
- Information on the Total Number of Voting Rights (Denominator) following Conversion Notice from Atlas
About author

Online


Add a comment
Comments
0 comments on the analysis OXURION - Daily