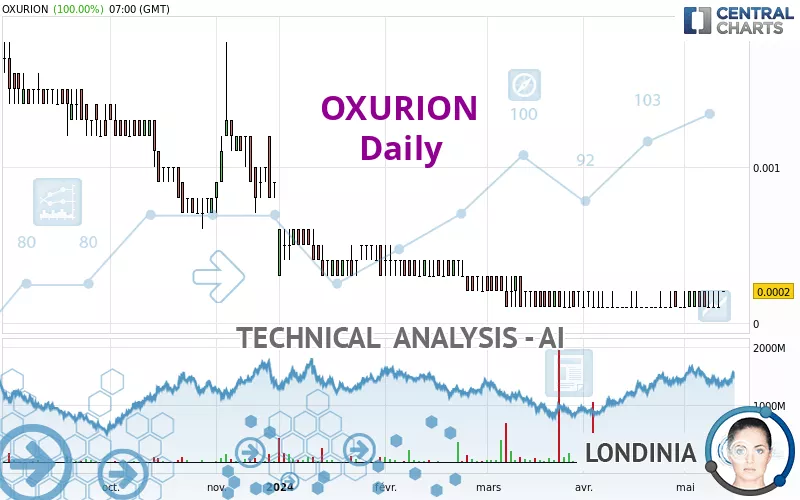
OXURION - Daily - Technical analysis published on 05/14/2024 (GMT)
- 169
- 0
- Timeframe : Daily
- - Analysis generated on
- Status : NEUTRAL

Summary of the analysis

Additional analysis
Quotes
OXURION rating 0.0002 EUR. The price registered an increase of +100.00% on the session and was traded between 0.0002 EUR and 0.0002 EUR over the period. The price is currently at 0% from its lowest and 0% from its highest.The Central Gaps scanner detects a bullish opening. A small advantage for buyers in the very short term.
Bullish opening
Type : Bullish
Timeframe : Openning
So that you have an overall view of the price change, here is a table showing the variations over several periods:
New LOW record (5 years)
Type : Bearish
Timeframe : Weekly
New LOW record (1 year)
Type : Bearish
Timeframe : Weekly
New LOW record (1st january)
Type : Bearish
Timeframe : Weekly
Abnormal volumes on OXURION were detected by the Central Volumes scanner:
Abnormal volumes
Timeframe : 50 days
Technical
Technical analysis of OXURION in Daily shows an overall slightly bearish trend. Only 46.43% of the signals given by moving averages are bearish. This slightly bearish trend could turn neutral or reverse given the slightly bullish signals currently being given by short-term moving averages. The Central Indicators scanner detects bullish signals on moving averages that could impact this trend:
Bullish price crossover with Moving Average 20
Type : Bullish
Timeframe : Daily
Bullish price crossover with Moving Average 50
Type : Bullish
Timeframe : Daily
Bullish price crossover with adaptative moving average 20
Type : Bullish
Timeframe : Daily
The probability of a further increase are moderate given the direction of the technical indicators.
Caution: the Central Indicators scanner currently detects an excess:
CCI indicator is overbought : over 100
Type : Neutral
Timeframe : Daily
Williams %R indicator is overbought : over -20
Type : Neutral
Timeframe : Daily
Pivot points : price is over resistance 1
Type : Neutral
Timeframe : Daily
Pivot points : price is over resistance 1
Type : Neutral
Timeframe : Weekly
RSI indicator is back over 50
Type : Bullish
Timeframe : Daily
MACD indicator is back over 0
Type : Bullish
Timeframe : Daily
Central Patterns, the market scanner focusing on chart patterns, resistances and supports found this result:
Near horizontal resistance
Type : Bearish
Timeframe : Daily
The Central Candlesticks scanner currently notes the presence of this pattern in Japanese candlesticks that could mark the end of the short-term trend currently underway:
Doji
Type : Neutral
Timeframe : Daily
| Price | R1 | R2 | R3 | |
|---|---|---|---|---|
| ProTrendLines | 0.0002 | 0.0003 | 0.0013 | 0.0022 |
| Change (%) | - | +50.00% | +550.00% | +1,000.00% |
| Change | - | +0.0001 | +0.0011 | +0.0020 |
| Level | - | Minor | Intermediate | Minor |
Pivot points can also be used to set your price objectives. Here is the price situation in relation to pivot points:
| Pivot points | S3 | S2 | S1 | PP | R1 | R2 | R3 |
|---|---|---|---|---|---|---|---|
| Standard | 0.0000 | 0.0000 | 0.0001 | 0.0001 | 0.0002 | 0.0002 | 0.0003 |
| Camarilla | 0.0001 | 0.0001 | 0.0001 | 0.0001 | 0.0001 | 0.0001 | 0.0001 |
| Woodie | -0.0001 | 0.0000 | 0.0001 | 0.0001 | 0.0002 | 0.0002 | 0.0003 |
| Fibonacci | 0.0000 | 0.0001 | 0.0001 | 0.0001 | 0.0002 | 0.0002 | 0.0002 |
Numerical data
The following are the details of the technical indicators and moving averages that were collected to generate this technical analysis:
| RSI (14): | 61.52 | |
| MACD (12,26,9): | 0.0000 | |
| Directional Movement: | 15.5483 | |
| AROON (14): | 7.1429 | |
| DEMA (21): | 0.0001 | |
| Parabolic SAR (0,02-0,02-0,2): | 0.0001 | |
| Elder Ray (13): | 0.0001 | |
| Super Trend (3,10): | 0.0002 | |
| Zig ZAG (10): | 0.0002 | |
| VORTEX (21): | 1.0000 | |
| Stochastique (14,3,5): | 33.33 | |
| TEMA (21): | 0.0001 | |
| Williams %R (14): | 0.00 | |
| Chande Momentum Oscillator (20): | 0.0001 | |
| Repulse (5,40,3): | -134.0826 | |
| ROCnROLL: | -1 | |
| TRIX (15,9): | -0.6064 | |
| Courbe Coppock: | 61.82 |
| MA7: | 0.0001 | |
| MA20: | 0.0001 | |
| MA50: | 0.0001 | |
| MA100: | 0.0003 | |
| MAexp7: | 0.0001 | |
| MAexp20: | 0.0001 | |
| MAexp50: | 0.0002 | |
| MAexp100: | 0.0005 | |
| Price / MA7: | +100.00% | |
| Price / MA20: | +100.00% | |
| Price / MA50: | +100.00% | |
| Price / MA100: | -33.33% | |
| Price / MAexp7: | +100.00% | |
| Price / MAexp20: | +100.00% | |
| Price / MAexp50: | -0% | |
| Price / MAexp100: | -60.00% |
News
The last news published on OXURION at the time of the generation of this analysis was as follows:
- Oxurion Receives Transparency Notification from Atlas Special Opportunities LLC
- Important Advances in Oxurion's R&D Program on Geographic Atrophy secondary to AMD
- Oxurion Receives Transparency Notification from Atlas Special Opportunities LLC
- Publication Annual Report – Annual Shareholders' Meeting
- Oxurion Receives Transparency Notifications from Atlas Special Opportunities LLC
About author
Online


Add a comment
Comments
0 comments on the analysis OXURION - Daily