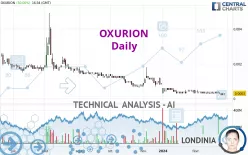
OXURION - Daily - Technical analysis published on 02/29/2024 (GMT)
- 157
- 0
Click here for a new analysis!
- Timeframe : Daily
- - Analysis generated on
- Status : TARGET REACHED

Summary of the analysis

Additional analysis
Quotes
OXURION rating 0.0003 EUR. The price registered an increase of +50.00% on the session and was between 0.0002 EUR and 0.0003 EUR. This implies that the price is at +50.00% from its lowest and at 0% from its highest.A bullish opening was detected by the Central Gaps scanner. Buyers are trying to impose a bullish momentum in the very short term.
Bullish opening
Type : Bullish
Timeframe : Openning
So that you have an overall view of the price change, here is a table showing the variations over several periods:
New LOW record (5 years)
Type : Bearish
Timeframe : Weekly
New LOW record (1 year)
Type : Bearish
Timeframe : Weekly
New LOW record (1st january)
Type : Bearish
Timeframe : Weekly
New LOW record (1 month)
Type : Bearish
Timeframe : Weekly
Abnormal volumes on OXURION were detected by the Central Volumes scanner:
Abnormal volumes
Timeframe : 5 days
Abnormal volumes
Timeframe : 50 days
Technical
Technical analysis of OXURION in Daily shows an overall bearish trend. 75.00% of the signals given by moving averages are bearish. Caution: the neutral signals currently given by short-term moving averages show us that the global trend is losing momentum. The Central Indicators scanner does not detect any result on moving averages that would impact this trend.
An assessment of technical indicators does not currently provide any relevant information to suggest whether the signal given by the technical indicators is more bullish or bearish.
Caution: the Central Indicators scanner currently detects an excess:
CCI indicator is oversold : under -100
Type : Neutral
Timeframe : Daily
Previous candle closed under Bollinger bands
Type : Neutral
Timeframe : Daily
MACD indicator: bullish divergence
Type : Bullish
Timeframe : Daily
Pivot points : price is over resistance 1
Type : Neutral
Timeframe : Daily
The Central Patterns scanner, which studies chart patterns, resistances and supports, has identified this signal:
Near horizontal resistance
Type : Bearish
Timeframe : Daily
Central Candlesticks, the scanner specialised in Japanese candlesticks, detects this inversion signal that could impact the current short-term trend:
Doji
Type : Neutral
Timeframe : Daily
| Price | R1 | R2 | R3 | |
|---|---|---|---|---|
| ProTrendLines | 0.0003 | 0.0007 | 0.0016 | 0.0035 |
| Change (%) | - | +133.33% | +433.33% | +1,066.67% |
| Change | - | +0.0004 | +0.0013 | +0.0032 |
| Level | - | Minor | Intermediate | Intermediate |
To determine price objectives, it is also possible to use the pivot points. Here is the price position in relation to pivot points:
| Pivot points | S3 | S2 | S1 | PP | R1 | R2 | R3 |
|---|---|---|---|---|---|---|---|
| Standard | 0.0001 | 0.0002 | 0.0002 | 0.0003 | 0.0003 | 0.0004 | 0.0004 |
| Camarilla | 0.0003 | 0.0003 | 0.0003 | 0.0003 | 0.0003 | 0.0003 | 0.0003 |
| Woodie | 0.0002 | 0.0002 | 0.0003 | 0.0003 | 0.0004 | 0.0004 | 0.0005 |
| Fibonacci | 0.0002 | 0.0002 | 0.0002 | 0.0003 | 0.0003 | 0.0003 | 0.0004 |
| Pivot points | S3 | S2 | S1 | PP | R1 | R2 | R3 |
|---|---|---|---|---|---|---|---|
| Standard | 0.0002 | 0.0002 | 0.0003 | 0.0003 | 0.0004 | 0.0004 | 0.0005 |
| Camarilla | 0.0003 | 0.0003 | 0.0003 | 0.0003 | 0.0003 | 0.0003 | 0.0003 |
| Woodie | 0.0002 | 0.0002 | 0.0003 | 0.0003 | 0.0004 | 0.0004 | 0.0005 |
| Fibonacci | 0.0002 | 0.0003 | 0.0003 | 0.0003 | 0.0004 | 0.0004 | 0.0004 |
| Pivot points | S3 | S2 | S1 | PP | R1 | R2 | R3 |
|---|---|---|---|---|---|---|---|
| Standard | -0.0001 | 0.0001 | 0.0002 | 0.0004 | 0.0005 | 0.0007 | 0.0008 |
| Camarilla | 0.0002 | 0.0003 | 0.0003 | 0.0003 | 0.0003 | 0.0004 | 0.0004 |
| Woodie | -0.0002 | 0.0001 | 0.0002 | 0.0004 | 0.0005 | 0.0007 | 0.0008 |
| Fibonacci | 0.0001 | 0.0002 | 0.0003 | 0.0004 | 0.0005 | 0.0006 | 0.0007 |
Numerical data
The following is the status of technical indicators and moving averages registered at the time this technical analysis was created:
| RSI (14): | 45.41 | |
| MACD (12,26,9): | -0.0001 | |
| Directional Movement: | -6.9117 | |
| AROON (14): | -85.7143 | |
| DEMA (21): | 0.0002 | |
| Parabolic SAR (0,02-0,02-0,2): | 0.0004 | |
| Elder Ray (13): | -0.0001 | |
| Super Trend (3,10): | 0.0006 | |
| Zig ZAG (10): | 0.0003 | |
| VORTEX (21): | 0.9167 | |
| Stochastique (14,3,5): | 16.67 | |
| TEMA (21): | 0.0003 | |
| Williams %R (14): | -50.00 | |
| Chande Momentum Oscillator (20): | 0.0000 | |
| Repulse (5,40,3): | -58.9073 | |
| ROCnROLL: | 2 | |
| TRIX (15,9): | -1.9460 | |
| Courbe Coppock: | 34.76 |
| MA7: | 0.0003 | |
| MA20: | 0.0003 | |
| MA50: | 0.0005 | |
| MA100: | 0.0008 | |
| MAexp7: | 0.0003 | |
| MAexp20: | 0.0003 | |
| MAexp50: | 0.0005 | |
| MAexp100: | 0.0012 | |
| Price / MA7: | -0% | |
| Price / MA20: | -0% | |
| Price / MA50: | -40.00% | |
| Price / MA100: | -62.50% | |
| Price / MAexp7: | -0% | |
| Price / MAexp20: | -0% | |
| Price / MAexp50: | -40.00% | |
| Price / MAexp100: | -75.00% |
News
Don't forget to follow the news on OXURION. At the time of publication of this analysis, the latest news was as follows:
- Oxurion Announces New Strategic Orientation to De-risk and Diversify
- Information on the Total Number of Voting Rights (Denominator) following Conversion Notices from Atlas
- Oxurion Receives Transparency Notification from Atlas Special Opportunities LLC
- Oxurion Receives Transparency Notification from Atlas Special Opportunities LLC
- Oxurion Avoids Bankruptcy, Announces Board and Management Changes and Enters into Binding Letter of Intent with its Main Creditor Atlas
About author
Online


Add a comment
Comments
0 comments on the analysis OXURION - Daily