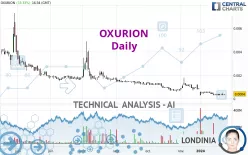
OXURION - Daily - Technical analysis published on 01/25/2024 (GMT)
- 166
- 0
Click here for a new analysis!
- Timeframe : Daily
- - Analysis generated on
- Status : INVALID

Summary of the analysis

Additional analysis
Quotes
OXURION rating 0.0004 EUR. The price registered an increase of +33.33% on the session with the lowest point at 0.0003 EUR and the highest point at 0.0004 EUR. The deviation from the price is +33.33% for the low point and 0% for the high point.A bullish opening was detected by the Central Gaps scanner. Buyers are trying to impose a bullish momentum in the very short term.
Bullish opening
Type : Bullish
Timeframe : Openning
So that you have an overall view of the price change, here is a table showing the variations over several periods:
New LOW record (5 years)
Type : Bearish
Timeframe : Weekly
New LOW record (1 year)
Type : Bearish
Timeframe : Weekly
New LOW record (1st january)
Type : Bearish
Timeframe : Weekly
New LOW record (1 month)
Type : Bearish
Timeframe : Weekly
The Central Volumes scanner notes the presence of abnormal volumes:
Abnormal volumes
Timeframe : 20 days
Abnormal volumes
Timeframe : 50 days
Technical
A technical analysis in Daily of this OXURION chart shows a sharp bearish trend. The signals given by moving averages are 92.86% bearish. This strong bearish trend is confirmed by the strong signals currently being given by short-term moving averages. There is no crossing of moving average by the price or crossing of moving averages between themselves.
On the 18 technical indicators analysed, 4 are bullish, 8 are neutral and 6 are bearish. Central Indicators, the detector scanner for these technical indicators recently detected a signal:
MACD crosses UP its Moving Average
Type : Bullish
Timeframe : Daily
Central Patterns, the market scanner focusing on chart patterns, resistances and supports found this result:
Near support of triangle
Type : Bullish
Timeframe : Daily
There is also a Japanese candlestick pattern detected by Central Candlesticks that could mark the end of the current short-term trend:
Doji
Type : Neutral
Timeframe : Daily
| S1 | Price | R1 | R2 | R3 | |
|---|---|---|---|---|---|
| ProTrendLines | 0.0003 | 0.0004 | 0.0016 | 0.0035 | 0.0055 |
| Change (%) | -25.00% | - | +300.00% | +775.00% | +1,275.00% |
| Change | -0.0001 | - | +0.0012 | +0.0031 | +0.0051 |
| Level | Intermediate | - | Intermediate | Minor | Minor |
Attention could also be paid to pivot points to set price objectives:
| Pivot points | S3 | S2 | S1 | PP | R1 | R2 | R3 |
|---|---|---|---|---|---|---|---|
| Standard | 0.0002 | 0.0003 | 0.0003 | 0.0004 | 0.0004 | 0.0005 | 0.0005 |
| Camarilla | 0.0004 | 0.0004 | 0.0004 | 0.0004 | 0.0004 | 0.0004 | 0.0004 |
| Woodie | 0.0003 | 0.0003 | 0.0004 | 0.0004 | 0.0005 | 0.0005 | 0.0006 |
| Fibonacci | 0.0003 | 0.0003 | 0.0003 | 0.0004 | 0.0004 | 0.0004 | 0.0005 |
| Pivot points | S3 | S2 | S1 | PP | R1 | R2 | R3 |
|---|---|---|---|---|---|---|---|
| Standard | 0.0001 | 0.0002 | 0.0003 | 0.0004 | 0.0005 | 0.0006 | 0.0007 |
| Camarilla | 0.0004 | 0.0004 | 0.0004 | 0.0004 | 0.0004 | 0.0004 | 0.0005 |
| Woodie | 0.0001 | 0.0002 | 0.0003 | 0.0004 | 0.0005 | 0.0006 | 0.0007 |
| Fibonacci | 0.0002 | 0.0003 | 0.0003 | 0.0004 | 0.0005 | 0.0005 | 0.0006 |
| Pivot points | S3 | S2 | S1 | PP | R1 | R2 | R3 |
|---|---|---|---|---|---|---|---|
| Standard | -0.0006 | 0.0000 | 0.0005 | 0.0011 | 0.0016 | 0.0022 | 0.0027 |
| Camarilla | 0.0006 | 0.0007 | 0.0008 | 0.0009 | 0.0010 | 0.0011 | 0.0012 |
| Woodie | -0.0008 | 0.0000 | 0.0004 | 0.0011 | 0.0015 | 0.0022 | 0.0026 |
| Fibonacci | 0.0000 | 0.0005 | 0.0007 | 0.0011 | 0.0016 | 0.0018 | 0.0022 |
Numerical data
The following are the details of the technical indicators and moving averages that were collected to generate this technical analysis:
| RSI (14): | 41.51 | |
| MACD (12,26,9): | -0.0001 | |
| Directional Movement: | -5.3736 | |
| AROON (14): | -50.0000 | |
| DEMA (21): | 0.0003 | |
| Parabolic SAR (0,02-0,02-0,2): | 0.0008 | |
| Elder Ray (13): | -0.0001 | |
| Super Trend (3,10): | 0.0008 | |
| Zig ZAG (10): | 0.0004 | |
| VORTEX (21): | 0.9143 | |
| Stochastique (14,3,5): | 22.22 | |
| TEMA (21): | 0.0003 | |
| Williams %R (14): | -66.67 | |
| Chande Momentum Oscillator (20): | -0.0001 | |
| Repulse (5,40,3): | -20.7287 | |
| ROCnROLL: | 2 | |
| TRIX (15,9): | -2.8627 | |
| Courbe Coppock: | 80.67 |
| MA7: | 0.0004 | |
| MA20: | 0.0005 | |
| MA50: | 0.0008 | |
| MA100: | 0.0013 | |
| MAexp7: | 0.0004 | |
| MAexp20: | 0.0005 | |
| MAexp50: | 0.0008 | |
| MAexp100: | 0.0017 | |
| Price / MA7: | -0% | |
| Price / MA20: | -20.00% | |
| Price / MA50: | -50.00% | |
| Price / MA100: | -69.23% | |
| Price / MAexp7: | -0% | |
| Price / MAexp20: | -20.00% | |
| Price / MAexp50: | -50.00% | |
| Price / MAexp100: | -76.47% |
News
The latest news and videos published on OXURION at the time of the analysis were as follows:
- Oxurion Announces New Strategic Orientation to De-risk and Diversify
- Information on the Total Number of Voting Rights (Denominator) following Conversion Notices from Atlas
- Oxurion Receives Transparency Notification from Atlas Special Opportunities LLC
- Oxurion Receives Transparency Notification from Atlas Special Opportunities LLC
- Oxurion Avoids Bankruptcy, Announces Board and Management Changes and Enters into Binding Letter of Intent with its Main Creditor Atlas
About author
Online


Add a comment
Comments
0 comments on the analysis OXURION - Daily