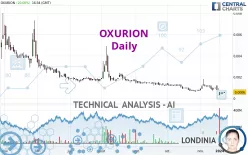
OXURION - Daily - Technical analysis published on 01/08/2024 (GMT)
- 235
- 0
Click here for a new analysis!
- Timeframe : Daily
- - Analysis generated on
- Status : TARGET REACHED

Summary of the analysis

Additional analysis
Quotes
The OXURION rating is 0.0006 EUR. On the day, this instrument gained +20.00% and was traded between 0.0005 EUR and 0.0006 EUR over the period. The price is currently at +20.00% from its lowest and 0% from its highest.So that you have an overall view of the price change, here is a table showing the variations over several periods:
New LOW record (5 years)
Type : Bearish
Timeframe : Weekly
New HIGH record (1st january)
Type : Bullish
Timeframe : Weekly
Abnormal volumes on OXURION were detected by the Central Volumes scanner:
Abnormal volumes
Timeframe : 5 days
Abnormal volumes
Timeframe : 20 days
Technical
Technical analysis of OXURION in Daily shows a overall strongly bearish trend. 92.86% of the signals given by moving averages are bearish. The overall trend is supported by the strong bearish signals from short-term moving averages. The Central Indicators market scanner currently does not detect any result that concerns moving averages.
In fact, of the 18 technical indicators analysed by Central Analyzer, 5 are bullish, 3 are neutral and 10 are bearish. Caution: the Central Indicators scanner currently detects an excess:
CCI indicator is oversold : under -100
Type : Neutral
Timeframe : Daily
Pivot points : price is over resistance 1
Type : Neutral
Timeframe : Daily
Pivot points : price is under support 1
Type : Neutral
Timeframe : Weekly
The Central Patterns scanner, which studies chart patterns, resistances and supports, has identified this signal:
Near horizontal resistance
Type : Bearish
Timeframe : Daily
The Central Candlesticks scanner, specialised in Japanese candlesticks, did not identify any signals.
| Price | R1 | R2 | R3 | |
|---|---|---|---|---|
| ProTrendLines | 0.0006 | 0.0016 | 0.0035 | 0.0055 |
| Change (%) | - | +166.67% | +483.33% | +816.67% |
| Change | - | +0.0010 | +0.0029 | +0.0049 |
| Level | - | Minor | Minor | Minor |
Attention could also be paid to pivot points to set price objectives:
| Pivot points | S3 | S2 | S1 | PP | R1 | R2 | R3 |
|---|---|---|---|---|---|---|---|
| Standard | 0.0004 | 0.0005 | 0.0005 | 0.0006 | 0.0006 | 0.0007 | 0.0007 |
| Camarilla | 0.0006 | 0.0006 | 0.0006 | 0.0006 | 0.0006 | 0.0006 | 0.0006 |
| Woodie | 0.0005 | 0.0005 | 0.0006 | 0.0006 | 0.0007 | 0.0007 | 0.0008 |
| Fibonacci | 0.0005 | 0.0005 | 0.0005 | 0.0006 | 0.0006 | 0.0006 | 0.0007 |
| Pivot points | S3 | S2 | S1 | PP | R1 | R2 | R3 |
|---|---|---|---|---|---|---|---|
| Standard | 0.0002 | 0.0004 | 0.0007 | 0.0009 | 0.0012 | 0.0014 | 0.0017 |
| Camarilla | 0.0008 | 0.0008 | 0.0009 | 0.0009 | 0.0010 | 0.0010 | 0.0010 |
| Woodie | 0.0002 | 0.0004 | 0.0007 | 0.0009 | 0.0012 | 0.0014 | 0.0017 |
| Fibonacci | 0.0004 | 0.0006 | 0.0007 | 0.0009 | 0.0011 | 0.0012 | 0.0014 |
| Pivot points | S3 | S2 | S1 | PP | R1 | R2 | R3 |
|---|---|---|---|---|---|---|---|
| Standard | -0.0006 | 0.0000 | 0.0005 | 0.0011 | 0.0016 | 0.0022 | 0.0027 |
| Camarilla | 0.0006 | 0.0007 | 0.0008 | 0.0009 | 0.0010 | 0.0011 | 0.0012 |
| Woodie | -0.0008 | 0.0000 | 0.0004 | 0.0011 | 0.0015 | 0.0022 | 0.0026 |
| Fibonacci | 0.0000 | 0.0005 | 0.0007 | 0.0011 | 0.0016 | 0.0018 | 0.0022 |
Numerical data
The following is the status of technical indicators and moving averages registered at the time this technical analysis was created:
| RSI (14): | 39.73 | |
| MACD (12,26,9): | -0.0001 | |
| Directional Movement: | -8.7741 | |
| AROON (14): | -78.5714 | |
| DEMA (21): | 0.0007 | |
| Parabolic SAR (0,02-0,02-0,2): | 0.0014 | |
| Elder Ray (13): | -0.0003 | |
| Super Trend (3,10): | 0.0012 | |
| Zig ZAG (10): | 0.0006 | |
| VORTEX (21): | 0.9583 | |
| Stochastique (14,3,5): | 18.89 | |
| TEMA (21): | 0.0006 | |
| Williams %R (14): | -70.00 | |
| Chande Momentum Oscillator (20): | -0.0006 | |
| Repulse (5,40,3): | 33.2571 | |
| ROCnROLL: | 2 | |
| TRIX (15,9): | -1.1052 | |
| Courbe Coppock: | 53.11 |
| MA7: | 0.0007 | |
| MA20: | 0.0009 | |
| MA50: | 0.0010 | |
| MA100: | 0.0014 | |
| MAexp7: | 0.0007 | |
| MAexp20: | 0.0008 | |
| MAexp50: | 0.0011 | |
| MAexp100: | 0.0020 | |
| Price / MA7: | -14.29% | |
| Price / MA20: | -33.33% | |
| Price / MA50: | -40.00% | |
| Price / MA100: | -57.14% | |
| Price / MAexp7: | -14.29% | |
| Price / MAexp20: | -25.00% | |
| Price / MAexp50: | -45.45% | |
| Price / MAexp100: | -70.00% |
News
The latest news and videos published on OXURION at the time of the analysis were as follows:
- Oxurion Avoids Bankruptcy, Announces Board and Management Changes and Enters into Binding Letter of Intent with its Main Creditor Atlas
- Oxurion Receives Transparency Notifications from Atlas Special Opportunities LLC
- Oxurion Discloses Topline Data from KALAHARI Phase 2, Part B Trial of Novel PKal Inhibitor THR-149 in Diabetic Macular Edema
- Information on the Total Number of Voting Rights (Denominator) following Conversion Notice from Atlas
- Information on the Total Number of Voting Rights (Denominator) following Conversion Notice from Atlas
About author
Online


Add a comment
Comments
0 comments on the analysis OXURION - Daily