| Open: | - |
| Change: | - |
| Volume: | - |
| Low: | - |
| High: | - |
| High / Low range: | - |
| Type: | Stocks |
| Ticker: | OXUR |
| ISIN: | BE0974487192 |
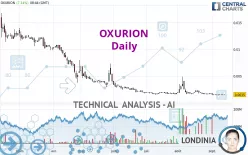
OXURION - Daily - Technical analysis published on 09/13/2023 (GMT)
- 174
- 0
- 09/13/2023 - 09:00
Click here for a new analysis!
- Timeframe : Daily
- - Analysis generated on 09/13/2023 - 09:00
- Status : TARGET REACHED

Summary of the analysis

Additional analysis
Quotes
OXURION rating 0.0015 EUR. The price registered an increase of +7.14% on the session and was traded between 0.0014 EUR and 0.0015 EUR over the period. The price is currently at +7.14% from its lowest and 0% from its highest.A bullish opening was detected by the Central Gaps scanner. Buyers are trying to impose a bullish momentum in the very short term.
Bullish opening
Type : Bullish
Timeframe : Openning
A study of price movements over other periods shows the following variations:
New LOW record (5 years)
Type : Bearish
Timeframe : Weekly
New LOW record (1 year)
Type : Bearish
Timeframe : Weekly
New LOW record (1st january)
Type : Bearish
Timeframe : Weekly
New LOW record (1 month)
Type : Bearish
Timeframe : Weekly
The Central Volumes scanner detects abnormal volumes on the asset:
Abnormal volumes
Timeframe : 20 days
Abnormal volumes
Timeframe : 50 days
Technical
Technical analysis of this Daily chart of OXURION indicates that the overall trend is strongly bearish. The signals given by moving averages are 92.86% bearish. This strong bearish trend is confirmed by the strong signals currently being given by short-term moving averages. The Central Indicators scanner does not detect any result on moving averages that would impact this trend.
On the 18 technical indicators analysed, 6 are bullish, 5 are neutral and 7 are bearish. But beware of excesses. The Central Indicators scanner currently detects this:
MACD indicator: bullish divergence
Type : Bullish
Timeframe : Daily
RSI indicator: bullish divergence
Type : Bullish
Timeframe : Daily
Pivot points : price is over resistance 1
Type : Neutral
Timeframe : Daily
Pivot points : price is under support 1
Type : Neutral
Timeframe : Weekly
The Central Patterns scanner, which studies chart patterns, resistances and supports, has identified this signal:
Near horizontal resistance
Type : Bearish
Timeframe : Daily
Central Candlesticks, the scanner specialised in Japanese candlesticks, detects this inversion signal that could impact the current short-term trend:
Doji
Type : Neutral
Timeframe : Daily
| Price | R1 | R2 | R3 | |
|---|---|---|---|---|
| ProTrendLines | 0.0015 | 0.0017 | 0.0121 | 0.0225 |
| Change (%) | - | +13.33% | +706.67% | +1,400.00% |
| Change | - | +0.0002 | +0.0106 | +0.0210 |
| Level | - | Minor | Minor | Minor |
To determine price objectives, it is also possible to use the pivot points. Here is the price position in relation to pivot points:
| Pivot points | S3 | S2 | S1 | PP | R1 | R2 | R3 |
|---|---|---|---|---|---|---|---|
| Standard | 0.0013 | 0.0013 | 0.0014 | 0.0014 | 0.0015 | 0.0015 | 0.0016 |
| Camarilla | 0.0014 | 0.0014 | 0.0014 | 0.0014 | 0.0014 | 0.0014 | 0.0014 |
| Woodie | 0.0013 | 0.0013 | 0.0014 | 0.0014 | 0.0015 | 0.0015 | 0.0016 |
| Fibonacci | 0.0013 | 0.0014 | 0.0014 | 0.0014 | 0.0015 | 0.0015 | 0.0015 |
| Pivot points | S3 | S2 | S1 | PP | R1 | R2 | R3 |
|---|---|---|---|---|---|---|---|
| Standard | 0.0012 | 0.0013 | 0.0014 | 0.0015 | 0.0016 | 0.0017 | 0.0018 |
| Camarilla | 0.0015 | 0.0015 | 0.0015 | 0.0015 | 0.0015 | 0.0015 | 0.0016 |
| Woodie | 0.0012 | 0.0013 | 0.0014 | 0.0015 | 0.0016 | 0.0017 | 0.0018 |
| Fibonacci | 0.0013 | 0.0014 | 0.0014 | 0.0015 | 0.0016 | 0.0016 | 0.0017 |
| Pivot points | S3 | S2 | S1 | PP | R1 | R2 | R3 |
|---|---|---|---|---|---|---|---|
| Standard | -0.0029 | -0.0007 | 0.0005 | 0.0027 | 0.0039 | 0.0061 | 0.0073 |
| Camarilla | 0.0008 | 0.0011 | 0.0014 | 0.0017 | 0.0020 | 0.0023 | 0.0026 |
| Woodie | -0.0034 | -0.0010 | 0.0000 | 0.0025 | 0.0034 | 0.0059 | 0.0068 |
| Fibonacci | -0.0007 | 0.0006 | 0.0014 | 0.0027 | 0.0040 | 0.0048 | 0.0061 |
Numerical data
The following are the details of the technical indicators and moving averages that were collected to generate this technical analysis:
| RSI (14): | 43.29 | |
| MACD (12,26,9): | -0.0001 | |
| Directional Movement: | 3.6380 | |
| AROON (14): | -42.8571 | |
| DEMA (21): | 0.0014 | |
| Parabolic SAR (0,02-0,02-0,2): | 0.0023 | |
| Elder Ray (13): | -0.0002 | |
| Super Trend (3,10): | 0.0021 | |
| Zig ZAG (10): | 0.0015 | |
| VORTEX (21): | 0.9362 | |
| Stochastique (14,3,5): | 13.89 | |
| TEMA (21): | 0.0014 | |
| Williams %R (14): | -75.00 | |
| Chande Momentum Oscillator (20): | -0.0002 | |
| Repulse (5,40,3): | -3.2837 | |
| ROCnROLL: | 2 | |
| TRIX (15,9): | -0.9940 | |
| Courbe Coppock: | 37.19 |
| MA7: | 0.0015 | |
| MA20: | 0.0017 | |
| MA50: | 0.0018 | |
| MA100: | 0.0027 | |
| MAexp7: | 0.0015 | |
| MAexp20: | 0.0016 | |
| MAexp50: | 0.0021 | |
| MAexp100: | 0.0052 | |
| Price / MA7: | -0% | |
| Price / MA20: | -11.76% | |
| Price / MA50: | -16.67% | |
| Price / MA100: | -44.44% | |
| Price / MAexp7: | -0% | |
| Price / MAexp20: | -6.25% | |
| Price / MAexp50: | -28.57% | |
| Price / MAexp100: | -71.15% |
News
Don't forget to follow the news on OXURION. At the time of publication of this analysis, the latest news was as follows:
- 09/11/2023 - 06:00 Oxurion Announces Key Amendments to Atlas and Kreos/Pontifax Agreements Enabling KALAHARI Trial to Progress to Topline Results in 2023
- 09/07/2023 - 17:00 Information on the Total Number of Voting Rights (Denominator) following Conversion Notice from Atlas
- 09/01/2023 - 17:00 Information on the Total Number of Voting Rights (Denominator) following Conversion Notice from Atlas
- 09/01/2023 - 17:00 Oxurion Receives Transparency Notification from Atlas Special Opportunities LLC
- 08/25/2023 - 20:00 Information on the Total Number of Voting Rights (Denominator) following Conversion Notice from Atlas
About author
Online


Add a comment
Comments
0 comments on the analysis OXURION - Daily