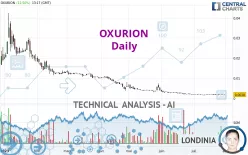
OXURION - Daily - Technical analysis published on 07/31/2023 (GMT)
- 215
- 0
Click here for a new analysis!
- Timeframe : Daily
- - Analysis generated on
- Status : INVALID

Summary of the analysis

Additional analysis
Quotes
The OXURION price is 0.0018 EUR. The price has increased by +12.50% since the last closing and was traded between 0.0016 EUR and 0.0018 EUR over the period. The price is currently at +12.50% from its lowest and 0% from its highest.The Central Gaps scanner detects a bullish opening. A small advantage for buyers in the very short term.
Bullish opening
Type : Bullish
Timeframe : Openning
Here is a more detailed summary of the historical variations registered by OXURION:
Technical
Technical analysis of OXURION in Daily shows an overall bearish trend. 78.57% of the signals given by moving averages are bearish. Caution: the neutral signals currently given by short-term moving averages show us that the global trend is losing momentum. The Central Indicators market scanner is currently detecting a bullish signal that could impact this trend:
Bullish price crossover with Moving Average 20
Type : Bullish
Timeframe : Daily
On the 18 technical indicators analysed, 7 are bullish, 7 are neutral and 4 are bearish. But beware of excesses. The Central Indicators scanner currently detects this:
CCI indicator: bullish divergence
Type : Bullish
Timeframe : Daily
RSI indicator: bullish divergence
Type : Bullish
Timeframe : Daily
Pivot points : price is over resistance 1
Type : Neutral
Timeframe : Daily
Pivot points : price is over resistance 1
Type : Neutral
Timeframe : Weekly
Momentum indicator is back over 0
Type : Bullish
Timeframe : Daily
An analysis of the price chart with the Central Patterns scanner (detector of chart patterns and resistances and supports) shows a result that can have an impact on the price change:
Near horizontal resistance
Type : Bearish
Timeframe : Daily
The Central Candlesticks scanner, specialised in Japanese candlesticks, did not identify any signals.
| Price | R1 | R2 | R3 | |
|---|---|---|---|---|
| ProTrendLines | 0.0018 | 0.0113 | 0.0352 | 0.1940 |
| Change (%) | - | +527.78% | +1,855.56% | +10,677.78% |
| Change | - | +0.0095 | +0.0334 | +0.1922 |
| Level | - | Minor | Minor | Major |
Pivot points can also be used to set your price objectives. Here is the price situation in relation to pivot points:
| Pivot points | S3 | S2 | S1 | PP | R1 | R2 | R3 |
|---|---|---|---|---|---|---|---|
| Standard | 0.0013 | 0.0015 | 0.0015 | 0.0017 | 0.0017 | 0.0019 | 0.0019 |
| Camarilla | 0.0016 | 0.0016 | 0.0016 | 0.0016 | 0.0016 | 0.0016 | 0.0017 |
| Woodie | 0.0013 | 0.0015 | 0.0015 | 0.0017 | 0.0017 | 0.0019 | 0.0019 |
| Fibonacci | 0.0015 | 0.0015 | 0.0016 | 0.0017 | 0.0017 | 0.0018 | 0.0019 |
| Pivot points | S3 | S2 | S1 | PP | R1 | R2 | R3 |
|---|---|---|---|---|---|---|---|
| Standard | 0.0012 | 0.0014 | 0.0015 | 0.0017 | 0.0018 | 0.0020 | 0.0021 |
| Camarilla | 0.0015 | 0.0016 | 0.0016 | 0.0016 | 0.0016 | 0.0017 | 0.0017 |
| Woodie | 0.0012 | 0.0014 | 0.0015 | 0.0017 | 0.0018 | 0.0020 | 0.0021 |
| Fibonacci | 0.0014 | 0.0015 | 0.0016 | 0.0017 | 0.0018 | 0.0019 | 0.0020 |
| Pivot points | S3 | S2 | S1 | PP | R1 | R2 | R3 |
|---|---|---|---|---|---|---|---|
| Standard | -0.0014 | 0.0001 | 0.0010 | 0.0025 | 0.0034 | 0.0049 | 0.0058 |
| Camarilla | 0.0011 | 0.0014 | 0.0016 | 0.0018 | 0.0020 | 0.0022 | 0.0025 |
| Woodie | -0.0018 | -0.0001 | 0.0006 | 0.0024 | 0.0030 | 0.0048 | 0.0054 |
| Fibonacci | 0.0001 | 0.0011 | 0.0016 | 0.0025 | 0.0035 | 0.0040 | 0.0049 |
Numerical data
The following is the status of the technical indicators and moving averages at the time of publication of this technical analysis:
| RSI (14): | 43.58 | |
| MACD (12,26,9): | -0.0002 | |
| Directional Movement: | -7.8828 | |
| AROON (14): | 35.7143 | |
| DEMA (21): | 0.0015 | |
| Parabolic SAR (0,02-0,02-0,2): | 0.0020 | |
| Elder Ray (13): | -0.0001 | |
| Super Trend (3,10): | 0.0023 | |
| Zig ZAG (10): | 0.0018 | |
| VORTEX (21): | 0.9459 | |
| Stochastique (14,3,5): | 36.67 | |
| TEMA (21): | 0.0017 | |
| Williams %R (14): | -50.00 | |
| Chande Momentum Oscillator (20): | 0.0001 | |
| Repulse (5,40,3): | -10.3372 | |
| ROCnROLL: | -1 | |
| TRIX (15,9): | -1.7309 | |
| Courbe Coppock: | 4.10 |
| MA7: | 0.0017 | |
| MA20: | 0.0018 | |
| MA50: | 0.0025 | |
| MA100: | 0.0053 | |
| MAexp7: | 0.0017 | |
| MAexp20: | 0.0018 | |
| MAexp50: | 0.0029 | |
| MAexp100: | 0.0103 | |
| Price / MA7: | +5.88% | |
| Price / MA20: | -0% | |
| Price / MA50: | -28.00% | |
| Price / MA100: | -66.04% | |
| Price / MAexp7: | +5.88% | |
| Price / MAexp20: | -0% | |
| Price / MAexp50: | -37.93% | |
| Price / MAexp100: | -82.52% |
News
The last news published on OXURION at the time of the generation of this analysis was as follows:
- Information on the Total Number of Voting Rights (Denominator) following Conversion Notice from Atlas
- Oxurion Receives Transparency Notifications from Atlas Special Opportunities LL
- Oxurion Receives Upfront Payment of $400,000 Following Oncurious Asset License by VIB
- Oxurion Receives Transparency Notification from Atlas Special Opportunities LLC
- Information on the Total Number of Voting Rights (Denominator) following Conversion Notice from Atlas
About author
Online


Add a comment
Comments
0 comments on the analysis OXURION - Daily