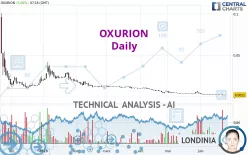
OXURION - Daily - Technical analysis published on 06/23/2023 (GMT)
- 156
- 0
Click here for a new analysis!
- Timeframe : Daily
- - Analysis generated on
- Status : TARGET REACHED

Summary of the analysis

Additional analysis
Quotes
OXURION rating 0.0021 EUR. The price registered an increase of +5.00% on the session and was between 0.0021 EUR and 0.0022 EUR. This implies that the price is at 0% from its lowest and at -4.55% from its highest.The Central Gaps scanner detects a bullish opening marking the presence of buyers ahead of sellers at the opening but not sufficiently marked to allow the price to register a quotation gap.
Bullish opening
Type : Bullish
Timeframe : Openning
So that you have an overall view of the price change, here is a table showing the variations over several periods:
New LOW record (5 years)
Type : Bearish
Timeframe : Weekly
Abnormal volumes on OXURION were detected by the Central Volumes scanner:
Abnormal volumes
Timeframe : 20 days
Technical
Technical analysis of OXURION in Daily shows a overall strongly bearish trend. The signals given by moving averages are 92.86% bearish. This strong bearish trend is confirmed by the strong signals currently being given by short-term moving averages. The Central Indicators market scanner currently does not detect any result that concerns moving averages.
The technical indicators are generally neutral. They do not provide relevant information on the direction of future price movements.
Caution: the Central Indicators scanner currently detects an excess:
CCI indicator is oversold : under -100
Type : Neutral
Timeframe : Daily
MACD indicator: bullish divergence
Type : Bullish
Timeframe : Daily
RSI indicator: bullish divergence
Type : Bullish
Timeframe : Daily
Williams %R indicator is oversold : under -80
Type : Neutral
Timeframe : Daily
Pivot points : price is under support 1
Type : Neutral
Timeframe : Weekly
Price is back under the pivot point
Type : Bearish
Timeframe : Daily
Central Patterns, the market scanner focusing on chart patterns, resistances and supports found this result:
Near horizontal resistance
Type : Bearish
Timeframe : Daily
The presence of a bullish Japanese candlestick pattern detected by Central Candlesticks that could cause a very short term rebound was also detected:
Bullish harami cross
Type : Bullish
Timeframe : Daily
| Price | R1 | R2 | R3 | |
|---|---|---|---|---|
| ProTrendLines | 0.0021 | 0.0118 | 0.0750 | 0.1050 |
| Change (%) | - | +461.90% | +3,471.43% | +4,900.00% |
| Change | - | +0.0097 | +0.0729 | +0.1029 |
| Level | - | Minor | Minor | Minor |
To determine price objectives, it is also possible to use the pivot points. Here is the price position in relation to pivot points:
| Pivot points | S3 | S2 | S1 | PP | R1 | R2 | R3 |
|---|---|---|---|---|---|---|---|
| Standard | 0.0010 | 0.0015 | 0.0017 | 0.0022 | 0.0024 | 0.0029 | 0.0031 |
| Camarilla | 0.0018 | 0.0019 | 0.0019 | 0.0020 | 0.0021 | 0.0021 | 0.0022 |
| Woodie | 0.0010 | 0.0014 | 0.0017 | 0.0021 | 0.0024 | 0.0028 | 0.0031 |
| Fibonacci | 0.0015 | 0.0017 | 0.0019 | 0.0022 | 0.0024 | 0.0026 | 0.0029 |
| Pivot points | S3 | S2 | S1 | PP | R1 | R2 | R3 |
|---|---|---|---|---|---|---|---|
| Standard | 0.0016 | 0.0020 | 0.0022 | 0.0026 | 0.0028 | 0.0032 | 0.0034 |
| Camarilla | 0.0022 | 0.0023 | 0.0024 | 0.0024 | 0.0025 | 0.0025 | 0.0026 |
| Woodie | 0.0015 | 0.0020 | 0.0021 | 0.0026 | 0.0027 | 0.0032 | 0.0033 |
| Fibonacci | 0.0020 | 0.0022 | 0.0024 | 0.0026 | 0.0028 | 0.0030 | 0.0032 |
| Pivot points | S3 | S2 | S1 | PP | R1 | R2 | R3 |
|---|---|---|---|---|---|---|---|
| Standard | -0.0022 | 0.0003 | 0.0022 | 0.0047 | 0.0066 | 0.0091 | 0.0110 |
| Camarilla | 0.0028 | 0.0032 | 0.0036 | 0.0040 | 0.0044 | 0.0048 | 0.0052 |
| Woodie | -0.0026 | 0.0002 | 0.0018 | 0.0046 | 0.0062 | 0.0090 | 0.0106 |
| Fibonacci | 0.0003 | 0.0020 | 0.0031 | 0.0047 | 0.0064 | 0.0075 | 0.0091 |
Numerical data
The following are the details of the technical indicators and moving averages that were collected to generate this technical analysis:
| RSI (14): | 33.34 | |
| MACD (12,26,9): | -0.0007 | |
| Directional Movement: | -15.4751 | |
| AROON (14): | -85.7142 | |
| DEMA (21): | 0.0020 | |
| Parabolic SAR (0,02-0,02-0,2): | 0.0036 | |
| Elder Ray (13): | -0.0005 | |
| Super Trend (3,10): | 0.0036 | |
| Zig ZAG (10): | 0.0021 | |
| VORTEX (21): | 0.9179 | |
| Stochastique (14,3,5): | 8.81 | |
| TEMA (21): | 0.0022 | |
| Williams %R (14): | -87.50 | |
| Chande Momentum Oscillator (20): | -0.0009 | |
| Repulse (5,40,3): | -36.6188 | |
| ROCnROLL: | 2 | |
| TRIX (15,9): | -2.4040 | |
| Courbe Coppock: | 61.28 |
| MA7: | 0.0024 | |
| MA20: | 0.0031 | |
| MA50: | 0.0044 | |
| MA100: | 0.0084 | |
| MAexp7: | 0.0024 | |
| MAexp20: | 0.0030 | |
| MAexp50: | 0.0050 | |
| MAexp100: | 0.0172 | |
| Price / MA7: | -12.50% | |
| Price / MA20: | -32.26% | |
| Price / MA50: | -52.27% | |
| Price / MA100: | -75.00% | |
| Price / MAexp7: | -12.50% | |
| Price / MAexp20: | -30.00% | |
| Price / MAexp50: | -58.00% | |
| Price / MAexp100: | -87.79% |
News
Don't forget to follow the news on OXURION. At the time of publication of this analysis, the latest news was as follows:
- Oxurion Receives Transparency Notification from Atlas Special Opportunities LLC
- Information on the Total Number of Voting Rights (Denominator) following Conversion Notice from Atlas
- Oxurion Receives Transparency Notification from Atlas Special Opportunities LLC
- Oxurion Issues EUR 1.0 million in Bonds for Tranche 3 of the Funding Program with Atlas Special Opportunities LLC
- Information on the Total Number of Voting Rights (Denominator) following Conversion Notice from Atlas
About author
Online


Add a comment
Comments
0 comments on the analysis OXURION - Daily