GENUS ORD 10P - Daily - Technical analysis published on 12/04/2019 (GMT)
- 288
- 0
- Who voted?
Click here for a new analysis!
- Timeframe : Daily
- - Analysis generated on
- Status : TARGET REACHED
Summary of the analysis

Additional analysis
Quotes
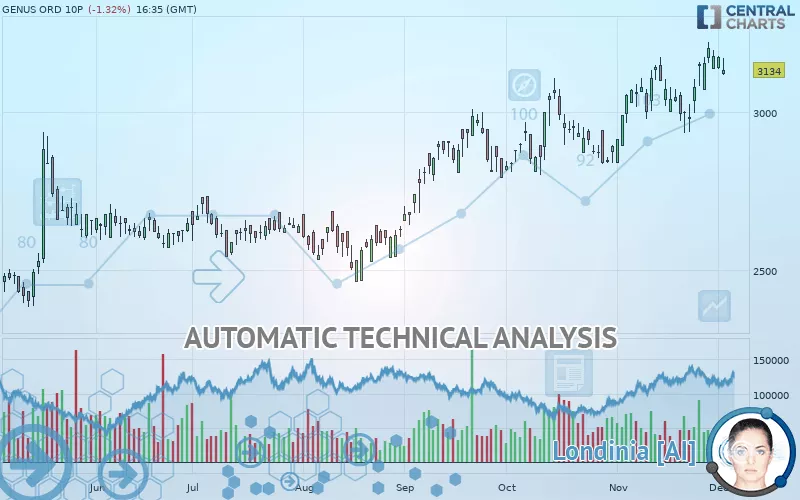
The GENUS ORD 10P rating is 3,134 GBX. The price registered a decrease of -1.32% on the session and was between 3,118 GBX and 3,172 GBX. This implies that the price is at +0.51% from its lowest and at -1.20% from its highest.The Central Gaps scanner detects a bearish gap which is a sign that the sellers have taken the lead in the very short term.
Opening Gap DOWN
Type : Bearish
Timeframe : Openning
So that you have an overall view of the price change, here is a table showing the variations over several periods:
Near a new HIGH record (5 years)
Type : Bullish
Timeframe : Weekly
Near a new HIGH record (1 year)
Type : Bullish
Timeframe : Weekly
Near a new HIGH record (1st january)
Type : Bullish
Timeframe : Weekly
Near a new HIGH record (1 month)
Type : Bullish
Timeframe : Weekly
Technical
Technical analysis of this Daily chart of GENUS ORD 10P indicates that the overall trend is strongly bullish. The signals given by the moving averages are 92.86% bullish. This strong bullish trend is confirmed by the strong signals currently being given by short-term moving averages. The Central Indicators market scanner currently does not detect any result that concerns moving averages.
In fact, only 8 technical indicators out of 18 studied are currently bullish. Caution: the Central Indicators scanner currently detects an excess:
CCI indicator is overbought : over 100
Type : Neutral
Timeframe : Daily
MACD indicator: bearish divergence
Type : Bearish
Timeframe : Daily
Williams %R indicator is overbought : over -20
Type : Neutral
Timeframe : Daily
Pivot points : price is under support 1
Type : Neutral
Timeframe : Daily
Price is back over the pivot point
Type : Bullish
Timeframe : Daily
Price is back over the pivot point
Type : Bullish
Timeframe : Weekly
The Central Patterns scanner, which studies chart patterns, resistances and supports, has identified this signal:
Near horizontal resistance
Type : Bearish
Timeframe : Daily
The Central Candlesticks scanner, specialised in Japanese candlesticks, did not identify any signals.
| S3 | S2 | S1 | Price | R1 | |
|---|---|---|---|---|---|
| ProTrendLines | 2,506 | 2,707 | 2,992 | 3,134 | 3,146 |
| Change (%) | -20.04% | -13.62% | -4.53% | - | +0.38% |
| Change | -628 | -427 | -142 | - | +12 |
| Level | Intermediate | Minor | Major | - | Major |
Pivot points can also be used to set your price objectives. Here is the price situation in relation to pivot points:
| Pivot points | S3 | S2 | S1 | PP | R1 | R2 | R3 |
|---|---|---|---|---|---|---|---|
| Standard | 3,107 | 3,123 | 3,149 | 3,165 | 3,191 | 3,207 | 3,233 |
| Camarilla | 3,164 | 3,168 | 3,172 | 3,176 | 3,180 | 3,184 | 3,188 |
| Woodie | 3,113 | 3,126 | 3,155 | 3,168 | 3,197 | 3,210 | 3,239 |
| Fibonacci | 3,123 | 3,139 | 3,149 | 3,165 | 3,181 | 3,191 | 3,207 |
| Pivot points | S3 | S2 | S1 | PP | R1 | R2 | R3 |
|---|---|---|---|---|---|---|---|
| Standard | 2,817 | 2,907 | 3,043 | 3,133 | 3,269 | 3,359 | 3,495 |
| Camarilla | 3,116 | 3,137 | 3,157 | 3,178 | 3,199 | 3,219 | 3,240 |
| Woodie | 2,839 | 2,919 | 3,065 | 3,145 | 3,291 | 3,371 | 3,517 |
| Fibonacci | 2,907 | 2,994 | 3,047 | 3,133 | 3,220 | 3,273 | 3,359 |
| Pivot points | S3 | S2 | S1 | PP | R1 | R2 | R3 |
|---|---|---|---|---|---|---|---|
| Standard | 2,521 | 2,671 | 2,924 | 3,074 | 3,328 | 3,478 | 3,731 |
| Camarilla | 3,067 | 3,104 | 3,141 | 3,178 | 3,215 | 3,252 | 3,289 |
| Woodie | 2,573 | 2,697 | 2,976 | 3,100 | 3,380 | 3,504 | 3,783 |
| Fibonacci | 2,671 | 2,825 | 2,920 | 3,074 | 3,228 | 3,324 | 3,478 |
Numerical data
The following is the status of technical indicators and moving averages registered at the time this technical analysis was created:
| RSI (14): | 59.00 | |
| MACD (12,26,9): | 56.0000 | |
| Directional Movement: | 9 | |
| AROON (14): | 36 | |
| DEMA (21): | 3,155 | |
| Parabolic SAR (0,02-0,02-0,2): | 2,996 | |
| Elder Ray (13): | 34 | |
| Super Trend (3,10): | 2,947 | |
| Zig ZAG (10): | 3,134 | |
| VORTEX (21): | 1.0000 | |
| Stochastique (14,3,5): | 79.00 | |
| TEMA (21): | 3,168 | |
| Williams %R (14): | -31.00 | |
| Chande Momentum Oscillator (20): | 58 | |
| Repulse (5,40,3): | 3.0000 | |
| ROCnROLL: | 1 | |
| TRIX (15,9): | 0.0000 | |
| Courbe Coppock: | 5.00 |
| MA7: | 3,154 | |
| MA20: | 3,089 | |
| MA50: | 2,971 | |
| MA100: | 2,820 | |
| MAexp7: | 3,141 | |
| MAexp20: | 3,082 | |
| MAexp50: | 2,983 | |
| MAexp100: | 2,861 | |
| Price / MA7: | -0.63% | |
| Price / MA20: | +1.46% | |
| Price / MA50: | +5.49% | |
| Price / MA100: | +11.13% | |
| Price / MAexp7: | -0.22% | |
| Price / MAexp20: | +1.69% | |
| Price / MAexp50: | +5.06% | |
| Price / MAexp100: | +9.54% |
News
Don"t forget to follow the news on GENUS ORD 10P. At the time of publication of this analysis, the latest news was as follows:
- Genus-SVX Impact Investment Counsel Launches With Goal Of Mobilizing Millions For Impact
-
 Genus Power Infra
-
Genus
About author

Online


Add a comment
Comments
0 comments on the analysis GENUS ORD 10P - Daily