| Open: | - |
| Change: | - |
| Volume: | - |
| Low: | - |
| High: | - |
| High / Low range: | - |
| Type: | Stocks |
| Ticker: | FAGR |
| ISIN: | BE0003874915 |
FAGRON - 1H - Technical analysis published on 01/07/2025 (GMT)
- 81
- 0
- 01/07/2025 - 13:05
Click here for a new analysis!
- Timeframe : 1H
- - Analysis generated on 01/07/2025 - 13:05
- Status : LEVEL MAINTAINED
Summary of the analysis

Additional analysis
Quotes
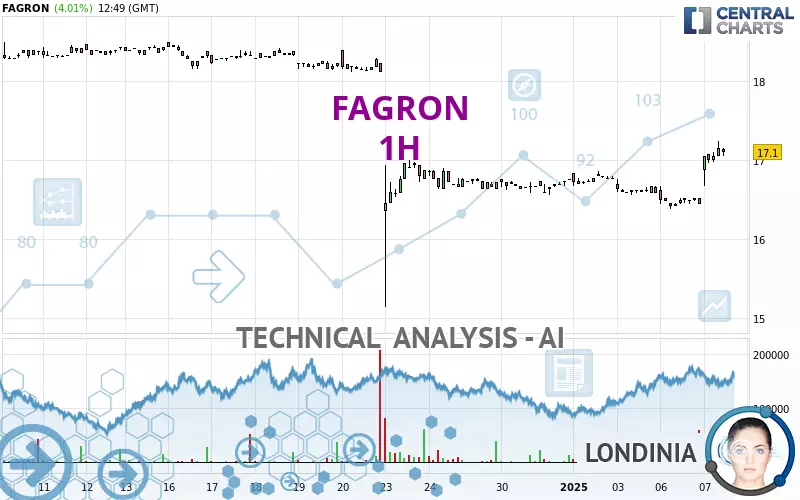
The FAGRON rating is 17.10 EUR. On the day, this instrument gained +4.02% and was between 16.68 EUR and 17.24 EUR. This implies that the price is at +2.52% from its lowest and at -0.81% from its highest.A bullish gap was detected at the opening by the Central Gaps scanner. There are a lot of buyers and they have the upper hand in the very short term.
Opening Gap UP
Type : Bullish
Timeframe : Openning
A study of price movements over other periods shows the following variations:
New HIGH record (1st january)
Type : Bullish
Timeframe : Weekly
Technical
A technical analysis in 1H of this FAGRON chart shows a slightly bullish trend. Only 53.57% of the signals given by moving averages are bullish. This slightly bullish trend is reinforced by the strong signals currently being given by short-term moving averages. The Central Indicators scanner detects bullish signals on moving averages that could impact this trend:
Bullish trend reversal : adaptative moving average 100
Type : Bullish
Timeframe : 1 hour
Moving Average bullish crossovers : AMA20 & AMA50
Type : Bullish
Timeframe : 1 hour
Moving Average bullish crossovers : AMA50 & AMA100
Type : Bullish
Timeframe : 1 hour
An assessment of technical indicators shows a strong bullish signal.
Caution: the Central Indicators scanner currently detects an excess:
CCI indicator is overbought : over 100
Type : Neutral
Timeframe : 1 hour
RSI indicator: bearish divergence
Type : Bearish
Timeframe : 1 hour
Williams %R indicator is overbought : over -20
Type : Neutral
Timeframe : 1 hour
Pivot points : price is over resistance 3
Type : Neutral
Timeframe : 1 hour
Pivot points : price is over resistance 3
Type : Neutral
Timeframe : Weekly
The Central Patterns scanner, which studies chart patterns, resistances and supports, has identified these signals:
Near horizontal resistance
Type : Bearish
Timeframe : 1 hour
Resistance of channel is broken
Type : Bullish
Timeframe : 1 hour
The presence of a bearish pattern in Japanese candlesticks detected by Central Candlesticks that could cause a correction in the very short term was also detected:
Bearish harami
Type : Bearish
Timeframe : 1 hour
| S3 | S2 | S1 | Price | R1 | R2 | R3 | |
|---|---|---|---|---|---|---|---|
| ProTrendLines | 15.14 | 15.55 | 16.66 | 17.10 | 17.27 | 18.09 | 18.50 |
| Change (%) | -11.46% | -9.06% | -2.57% | - | +0.99% | +5.79% | +8.19% |
| Change | -1.96 | -1.55 | -0.44 | - | +0.17 | +0.99 | +1.40 |
| Level | Intermediate | Minor | Major | - | Major | Major | Intermediate |
Pivot points can also be used to set your price objectives. Here is the price situation in relation to pivot points:
| Pivot points | S3 | S2 | S1 | PP | R1 | R2 | R3 |
|---|---|---|---|---|---|---|---|
| Standard | 16.02 | 16.20 | 16.32 | 16.50 | 16.62 | 16.80 | 16.92 |
| Camarilla | 16.36 | 16.39 | 16.41 | 16.44 | 16.47 | 16.50 | 16.52 |
| Woodie | 15.99 | 16.19 | 16.29 | 16.49 | 16.59 | 16.79 | 16.89 |
| Fibonacci | 16.20 | 16.32 | 16.39 | 16.50 | 16.62 | 16.69 | 16.80 |
| Pivot points | S3 | S2 | S1 | PP | R1 | R2 | R3 |
|---|---|---|---|---|---|---|---|
| Standard | 16.17 | 16.37 | 16.47 | 16.67 | 16.77 | 16.97 | 17.07 |
| Camarilla | 16.50 | 16.53 | 16.55 | 16.58 | 16.61 | 16.64 | 16.66 |
| Woodie | 16.13 | 16.35 | 16.43 | 16.65 | 16.73 | 16.95 | 17.03 |
| Fibonacci | 16.37 | 16.48 | 16.55 | 16.67 | 16.78 | 16.85 | 16.97 |
| Pivot points | S3 | S2 | S1 | PP | R1 | R2 | R3 |
|---|---|---|---|---|---|---|---|
| Standard | 11.42 | 13.28 | 15.02 | 16.88 | 18.62 | 20.48 | 22.22 |
| Camarilla | 15.77 | 16.10 | 16.43 | 16.76 | 17.09 | 17.42 | 17.75 |
| Woodie | 11.36 | 13.25 | 14.96 | 16.85 | 18.56 | 20.45 | 22.16 |
| Fibonacci | 13.28 | 14.66 | 15.51 | 16.88 | 18.26 | 19.11 | 20.48 |
Numerical data
The following are the details of the technical indicators and moving averages that were collected to generate this technical analysis:
| RSI (14): | 69.14 | |
| MACD (12,26,9): | 0.0900 | |
| Directional Movement: | 28.77 | |
| AROON (14): | 71.43 | |
| DEMA (21): | 16.85 | |
| Parabolic SAR (0,02-0,02-0,2): | 16.52 | |
| Elder Ray (13): | 0.31 | |
| Super Trend (3,10): | 16.77 | |
| Zig ZAG (10): | 17.12 | |
| VORTEX (21): | 1.1200 | |
| Stochastique (14,3,5): | 90.40 | |
| TEMA (21): | 16.99 | |
| Williams %R (14): | -13.95 | |
| Chande Momentum Oscillator (20): | 0.64 | |
| Repulse (5,40,3): | 0.4800 | |
| ROCnROLL: | 1 | |
| TRIX (15,9): | 0.0100 | |
| Courbe Coppock: | 4.08 |
| MA7: | 16.73 | |
| MA20: | 17.61 | |
| MA50: | 18.19 | |
| MA100: | 18.47 | |
| MAexp7: | 16.95 | |
| MAexp20: | 16.77 | |
| MAexp50: | 16.80 | |
| MAexp100: | 17.10 | |
| Price / MA7: | +2.21% | |
| Price / MA20: | -2.90% | |
| Price / MA50: | -5.99% | |
| Price / MA100: | -7.42% | |
| Price / MAexp7: | +0.88% | |
| Price / MAexp20: | +1.97% | |
| Price / MAexp50: | +1.79% | |
| Price / MAexp100: | -0% |
News
The last news published on FAGRON at the time of the generation of this analysis was as follows:
- 01/07/2025 - 06:00 Fagron strengthens its market positioning with the acquisitions of CareFirst in North America and Injeplast in Brazil
- 12/23/2024 - 06:00 Fagron updates on FDA communication regarding the June 2024 inspection at Wichita
- 10/10/2024 - 05:00 Fagron reports outstanding third quarter 2024 performance with 12.1% revenue growth and reaffirms full-year outlook
- 08/30/2024 - 16:34 Fagron’s share buy-back program: Weekly update
- 08/23/2024 - 16:44 Fagron’s share buy-back program: Weekly update
About author
Online


Add a comment
Comments
0 comments on the analysis FAGRON - 1H