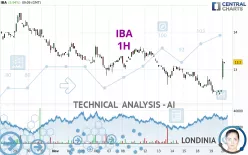
IBA - 1H - Technical analysis published on 11/20/2024 (GMT)
- 160
- 0
Click here for a new analysis!
- Timeframe : 1H
- - Analysis generated on
- Status : TARGET REACHED

Summary of the analysis

Additional analysis
Quotes
The IBA rating is 13.20 EUR. The price registered an increase of +5.94% on the session with the lowest point at 12.74 EUR and the highest point at 13.28 EUR. The deviation from the price is +3.61% for the low point and -0.60% for the high point.A bullish gap was detected at the opening by the Central Gaps scanner. There are a lot of buyers and they have the upper hand in the very short term.
Opening Gap UP
Type : Bullish
Timeframe : Openning
A study of price movements over other periods shows the following variations:
Near a new LOW record (1 month)
Type : Bearish
Timeframe : Weekly
Technical
Technical analysis of IBA in 1H shows an overall slightly bullish trend. 53.57% of the signals given by moving averages are bullish. This slightly bullish trend could be reinforced by the strong bullish signals given by short-term moving averages. An assessment of moving averages reveals several bullish signals that could impact this trend:
Bullish trend reversal : Moving Average 20
Type : Bullish
Timeframe : 1 hour
Bullish trend reversal : adaptative moving average 20
Type : Bullish
Timeframe : 1 hour
Bullish trend reversal : adaptative moving average 50
Type : Bullish
Timeframe : 1 hour
Bullish trend reversal : adaptative moving average 100
Type : Bullish
Timeframe : 1 hour
In fact, 13 technical indicators on 18 studied are currently positioned bullish. Caution: the Central Indicators scanner currently detects an excess:
CCI indicator is overbought : over 100
Type : Neutral
Timeframe : 1 hour
Williams %R indicator is overbought : over -20
Type : Neutral
Timeframe : 1 hour
Pivot points : price is over resistance 3
Type : Neutral
Timeframe : 1 hour
Price is back over the pivot point
Type : Bullish
Timeframe : Weekly
The Central Patterns scanner, which studies chart patterns, resistances and supports, has identified these signals:
Near horizontal resistance
Type : Bearish
Timeframe : 1 hour
Resistance of channel is broken
Type : Bullish
Timeframe : 1 hour
For a small setback in the very short term, the Central Candlesticks scanner currently notes the presence of this bearish pattern in Japanese candlesticks:
Bearish harami cross
Type : Bearish
Timeframe : 1 hour
| S3 | S2 | S1 | Price | R1 | R2 | R3 | |
|---|---|---|---|---|---|---|---|
| ProTrendLines | 12.45 | 12.83 | 13.14 | 13.20 | 13.80 | 14.05 | 14.31 |
| Change (%) | -5.68% | -2.80% | -0.45% | - | +4.55% | +6.44% | +8.41% |
| Change | -0.75 | -0.37 | -0.06 | - | +0.60 | +0.85 | +1.11 |
| Level | Minor | Intermediate | Intermediate | - | Intermediate | Minor | Intermediate |
Pivot points can also be used to set your price objectives. Here is the price situation in relation to pivot points:
| Pivot points | S3 | S2 | S1 | PP | R1 | R2 | R3 |
|---|---|---|---|---|---|---|---|
| Standard | 11.91 | 12.11 | 12.29 | 12.49 | 12.67 | 12.87 | 13.05 |
| Camarilla | 12.36 | 12.39 | 12.43 | 12.46 | 12.50 | 12.53 | 12.57 |
| Woodie | 11.89 | 12.11 | 12.27 | 12.49 | 12.65 | 12.87 | 13.03 |
| Fibonacci | 12.11 | 12.26 | 12.35 | 12.49 | 12.64 | 12.73 | 12.87 |
| Pivot points | S3 | S2 | S1 | PP | R1 | R2 | R3 |
|---|---|---|---|---|---|---|---|
| Standard | 11.33 | 11.97 | 12.33 | 12.97 | 13.33 | 13.97 | 14.33 |
| Camarilla | 12.43 | 12.52 | 12.61 | 12.70 | 12.79 | 12.88 | 12.98 |
| Woodie | 11.20 | 11.90 | 12.20 | 12.90 | 13.20 | 13.90 | 14.20 |
| Fibonacci | 11.97 | 12.35 | 12.59 | 12.97 | 13.35 | 13.59 | 13.97 |
| Pivot points | S3 | S2 | S1 | PP | R1 | R2 | R3 |
|---|---|---|---|---|---|---|---|
| Standard | 10.61 | 11.81 | 12.75 | 13.95 | 14.89 | 16.09 | 17.03 |
| Camarilla | 13.11 | 13.31 | 13.50 | 13.70 | 13.90 | 14.09 | 14.29 |
| Woodie | 10.49 | 11.75 | 12.63 | 13.89 | 14.77 | 16.03 | 16.91 |
| Fibonacci | 11.81 | 12.62 | 13.13 | 13.95 | 14.76 | 15.27 | 16.09 |
Numerical data
The following is the status of the technical indicators and moving averages at the time of publication of this technical analysis:
| RSI (14): | 67.32 | |
| MACD (12,26,9): | -0.0100 | |
| Directional Movement: | 27.94 | |
| AROON (14): | 28.57 | |
| DEMA (21): | 12.64 | |
| Parabolic SAR (0,02-0,02-0,2): | 12.34 | |
| Elder Ray (13): | 0.48 | |
| Super Trend (3,10): | 12.70 | |
| Zig ZAG (10): | 13.20 | |
| VORTEX (21): | 0.9700 | |
| Stochastique (14,3,5): | 71.14 | |
| TEMA (21): | 12.73 | |
| Williams %R (14): | -8.33 | |
| Chande Momentum Oscillator (20): | 0.62 | |
| Repulse (5,40,3): | 3.5600 | |
| ROCnROLL: | 1 | |
| TRIX (15,9): | -0.1100 | |
| Courbe Coppock: | 0.91 |
| MA7: | 12.88 | |
| MA20: | 13.37 | |
| MA50: | 13.54 | |
| MA100: | 12.81 | |
| MAexp7: | 12.79 | |
| MAexp20: | 12.69 | |
| MAexp50: | 12.84 | |
| MAexp100: | 13.07 | |
| Price / MA7: | +2.48% | |
| Price / MA20: | -1.27% | |
| Price / MA50: | -2.51% | |
| Price / MA100: | +3.04% | |
| Price / MAexp7: | +3.21% | |
| Price / MAexp20: | +4.02% | |
| Price / MAexp50: | +2.80% | |
| Price / MAexp100: | +0.99% |
News
The latest news and videos published on IBA at the time of the analysis were as follows:
- IBA’s joint venture PanTera secures EUR 93 million in oversubscribed Series A round to accelerate global actinium-225 production
- IBA Reports Half Year 2024 Results
- IBA signs contract with Yale New Haven Health and Hartford HealthCare to install Proteus®ONE proton therapy solution in Connecticut, US
- IBA Reports Full Year 2023 Results
- PanTera signs a second agreement for the supply of actinium-225
About author
Online


Add a comment
Comments
0 comments on the analysis IBA - 1H