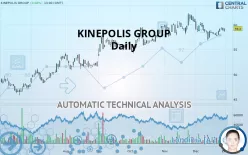
KINEPOLIS GROUP - Daily - Technical analysis published on 12/31/2019 (GMT)
- 354
- 0
- Who voted?
Click here for a new analysis!
- Timeframe : Daily
- - Analysis generated on
- Status : INVALID

Summary of the analysis

Additional analysis
Quotes
KINEPOLIS GROUP rating 59.2 EUR. On the day, this instrument gained +0.68% and was traded between 58.6 EUR and 59.2 EUR over the period. The price is currently at +1.02% from its lowest and 0% from its highest.A bearish gap was detected at the opening by the Central Gaps scanner. There are a lot of sellers and they have the upper hand in the very short term.
Opening Gap DOWN
Type : Bearish
Timeframe : Openning
Here is a more detailed summary of the historical variations registered by KINEPOLIS GROUP:
Near a new HIGH record (5 years)
Type : Bullish
Timeframe : Weekly
Technical
Technical analysis of this Daily chart of KINEPOLIS GROUP indicates that the overall trend is strongly bullish. 85.71% of the signals given by moving averages are bullish. The slightly bullish signals given by the short-term moving averages show a weakening of the global trend. The Central Indicators scanner detects bearish signals on moving averages that could impact this trend:
Moving Average bearish crossovers : MA20 & MA50
Type : Bearish
Timeframe : Daily
Bearish price crossover with Moving Average 20
Type : Bearish
Timeframe : Daily
Bearish price crossover with Moving Average 50
Type : Bearish
Timeframe : Daily
In fact, 10 technical indicators on 18 studied are currently positioned bullish. Caution: the Central Indicators scanner currently detects an excess:
Williams %R indicator is overbought : over -20
Type : Neutral
Timeframe : Daily
Pivot points : price is over resistance 1
Type : Neutral
Timeframe : Daily
RSI indicator is back under 50
Type : Bearish
Timeframe : Daily
MACD crosses UP its Moving Average
Type : Bullish
Timeframe : Daily
Price is back over the pivot point
Type : Bullish
Timeframe : Weekly
Price is back under the pivot point
Type : Bearish
Timeframe : Daily
Central Patterns, the scanner specializing in chart patterns, did not identify any signals.
The presence of a bearish pattern in Japanese candlesticks detected by Central Candlesticks that could cause a correction in the very short term was also detected:
Bearish engulfing lines
Type : Bearish
Timeframe : Daily
| S3 | S2 | S1 | Price | R1 | R2 | |
|---|---|---|---|---|---|---|
| ProTrendLines | 54.9 | 57.4 | 58.6 | 59.2 | 59.9 | 61.3 |
| Change (%) | -7.26% | -3.04% | -1.01% | - | +1.18% | +3.55% |
| Change | -4.3 | -1.8 | -0.6 | - | +0.7 | +2.1 |
| Level | Major | Major | Major | - | Minor | Major |
Pivot points can also be used to set your price objectives. Here is the price situation in relation to pivot points:
| Pivot points | S3 | S2 | S1 | PP | R1 | R2 | R3 |
|---|---|---|---|---|---|---|---|
| Standard | 58.0 | 58.4 | 58.6 | 59.0 | 59.2 | 59.6 | 59.8 |
| Camarilla | 58.6 | 58.7 | 58.8 | 58.8 | 58.9 | 58.9 | 59.0 |
| Woodie | 57.9 | 58.4 | 58.5 | 59.0 | 59.1 | 59.6 | 59.7 |
| Fibonacci | 58.4 | 58.6 | 58.8 | 59.0 | 59.2 | 59.4 | 59.6 |
| Pivot points | S3 | S2 | S1 | PP | R1 | R2 | R3 |
|---|---|---|---|---|---|---|---|
| Standard | 56.6 | 57.3 | 58.2 | 58.9 | 59.8 | 60.5 | 61.4 |
| Camarilla | 58.8 | 58.9 | 59.1 | 59.2 | 59.4 | 59.5 | 59.6 |
| Woodie | 56.8 | 57.4 | 58.4 | 59.0 | 60.0 | 60.6 | 61.6 |
| Fibonacci | 57.3 | 57.9 | 58.3 | 58.9 | 59.5 | 59.9 | 60.5 |
| Pivot points | S3 | S2 | S1 | PP | R1 | R2 | R3 |
|---|---|---|---|---|---|---|---|
| Standard | 53.4 | 55.5 | 58.2 | 60.3 | 63.0 | 65.1 | 67.8 |
| Camarilla | 59.7 | 60.1 | 60.6 | 61.0 | 61.4 | 61.9 | 62.3 |
| Woodie | 53.8 | 55.7 | 58.6 | 60.5 | 63.4 | 65.3 | 68.2 |
| Fibonacci | 55.5 | 57.3 | 58.4 | 60.3 | 62.1 | 63.2 | 65.1 |
Numerical data
The following is the status of the technical indicators and moving averages at the time of publication of this technical analysis:
| RSI (14): | 52.40 | |
| MACD (12,26,9): | -0.1000 | |
| Directional Movement: | -4.3 | |
| AROON (14): | -21.4 | |
| DEMA (21): | 58.7 | |
| Parabolic SAR (0,02-0,02-0,2): | 59.5 | |
| Elder Ray (13): | 0.1 | |
| Super Trend (3,10): | 60.9 | |
| Zig ZAG (10): | 59.2 | |
| VORTEX (21): | 0.9000 | |
| Stochastique (14,3,5): | 74.00 | |
| TEMA (21): | 58.5 | |
| Williams %R (14): | -11.10 | |
| Chande Momentum Oscillator (20): | 0.5 | |
| Repulse (5,40,3): | 0.9000 | |
| ROCnROLL: | 1 | |
| TRIX (15,9): | 0.0000 | |
| Courbe Coppock: | 1.70 |
| MA7: | 58.6 | |
| MA20: | 58.7 | |
| MA50: | 59.0 | |
| MA100: | 57.0 | |
| MAexp7: | 58.8 | |
| MAexp20: | 58.8 | |
| MAexp50: | 58.5 | |
| MAexp100: | 57.0 | |
| Price / MA7: | +1.02% | |
| Price / MA20: | +0.85% | |
| Price / MA50: | +0.34% | |
| Price / MA100: | +3.86% | |
| Price / MAexp7: | +0.68% | |
| Price / MAexp20: | +0.68% | |
| Price / MAexp50: | +1.20% | |
| Price / MAexp100: | +3.86% |
News
Don"t forget to follow the news on KINEPOLIS GROUP. At the time of publication of this analysis, the latest news was as follows:
- Consistent implementation of business and expansion strategy results in 7.3% higher revenue and 10.6% higher EBITDA for Kinepolis in the first half-year
- Minutes Ordinary General Meeting
- After a weaker first quarter, Kinepolis is back on track thanks to ‘Avengers: Endgame’
- Kinepolis Group publishes 2018 annual report
- Canadian acquisition contributes significantly to Kinepolis Group's first half-year results for 2018
About author

Online


Add a comment
Comments
0 comments on the analysis KINEPOLIS GROUP - Daily