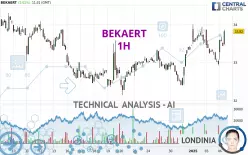
BEKAERT - 1H - Technical analysis published on 01/06/2025 (GMT)
- 105
- 0
Click here for a new analysis!
- Timeframe : 1H
- - Analysis generated on
- Status : TARGET REACHED

Summary of the analysis

Additional analysis
Quotes
BEKAERT rating 33.82 EUR. The price registered an increase of +2.61% on the session with the lowest point at 33.08 EUR and the highest point at 33.86 EUR. The deviation from the price is +2.24% for the low point and -0.12% for the high point.The Central Gaps scanner detects a bullish opening marking the presence of buyers ahead of sellers at the opening but not sufficiently marked to allow the price to register a quotation gap.
Bullish opening
Type : Bullish
Timeframe : Openning
Here is a more detailed summary of the historical variations registered by BEKAERT:
Near a new LOW record (1st january)
Type : Bearish
Timeframe : Weekly
Near a new LOW record (1 month)
Type : Bearish
Timeframe : Weekly
Technical
Technical analysis of BEKAERT in 1H shows a strongly overall bullish trend. 92.86% of the signals given by moving averages are bullish. The overall trend is supported by the strong bullish signals from short-term moving averages. The Central Indicators market scanner is currently detecting several bearish and bullish signals that could impact this trend:
Bearish trend reversal : Moving Average 20
Type : Bearish
Timeframe : 1 hour
Bullish price crossover with Moving Average 20
Type : Bullish
Timeframe : 1 hour
In fact, according to the parameters integrated into the Central Analyzer system, 14 technical indicators out of 18 analysed are currently bullish. Central Indicators, the scanner specialised in technical indicators, has identified these signals:
Pivot points : price is over resistance 1
Type : Neutral
Timeframe : 1 hour
MACD crosses UP its Moving Average
Type : Bullish
Timeframe : 1 hour
Momentum indicator is back over 0
Type : Bullish
Timeframe : 1 hour
Central Patterns, the scanner specializing in chart patterns, did not identify any signals.
For a small setback in the very short term, the Central Candlesticks scanner currently notes the presence of this bearish pattern in Japanese candlesticks:
Downside Tasuki gap
Type : Bearish
Timeframe : 1 hour
| S3 | S2 | S1 | Price | R1 | R2 | R3 | |
|---|---|---|---|---|---|---|---|
| ProTrendLines | 32.40 | 33.04 | 33.72 | 33.82 | 34.00 | 34.30 | 35.87 |
| Change (%) | -4.20% | -2.31% | -0.30% | - | +0.53% | +1.42% | +6.06% |
| Change | -1.42 | -0.78 | -0.10 | - | +0.18 | +0.48 | +2.05 |
| Level | Intermediate | Intermediate | Intermediate | - | Minor | Minor | Major |
Pivot points can also be used to set your price objectives. Here is the price situation in relation to pivot points:
| Pivot points | S3 | S2 | S1 | PP | R1 | R2 | R3 |
|---|---|---|---|---|---|---|---|
| Standard | 31.69 | 32.31 | 32.63 | 33.25 | 33.57 | 34.19 | 34.51 |
| Camarilla | 32.70 | 32.79 | 32.87 | 32.96 | 33.05 | 33.13 | 33.22 |
| Woodie | 31.55 | 32.24 | 32.49 | 33.18 | 33.43 | 34.12 | 34.37 |
| Fibonacci | 32.31 | 32.67 | 32.89 | 33.25 | 33.61 | 33.83 | 34.19 |
| Pivot points | S3 | S2 | S1 | PP | R1 | R2 | R3 |
|---|---|---|---|---|---|---|---|
| Standard | 30.64 | 31.52 | 32.24 | 33.12 | 33.84 | 34.72 | 35.44 |
| Camarilla | 32.52 | 32.67 | 32.81 | 32.96 | 33.11 | 33.25 | 33.40 |
| Woodie | 30.56 | 31.48 | 32.16 | 33.08 | 33.76 | 34.68 | 35.36 |
| Fibonacci | 31.52 | 32.13 | 32.51 | 33.12 | 33.73 | 34.11 | 34.72 |
| Pivot points | S3 | S2 | S1 | PP | R1 | R2 | R3 |
|---|---|---|---|---|---|---|---|
| Standard | 30.14 | 31.14 | 32.30 | 33.30 | 34.46 | 35.46 | 36.62 |
| Camarilla | 32.87 | 33.06 | 33.26 | 33.46 | 33.66 | 33.86 | 34.05 |
| Woodie | 30.22 | 31.18 | 32.38 | 33.34 | 34.54 | 35.50 | 36.70 |
| Fibonacci | 31.14 | 31.97 | 32.48 | 33.30 | 34.13 | 34.64 | 35.46 |
Numerical data
The following is the status of the technical indicators and moving averages at the time of publication of this technical analysis:
| RSI (14): | 55.82 | |
| MACD (12,26,9): | 0.0700 | |
| Directional Movement: | 20.21 | |
| AROON (14): | -71.43 | |
| DEMA (21): | 33.48 | |
| Parabolic SAR (0,02-0,02-0,2): | 32.95 | |
| Elder Ray (13): | 0.25 | |
| Super Trend (3,10): | 33.02 | |
| Zig ZAG (10): | 33.82 | |
| VORTEX (21): | 0.9600 | |
| Stochastique (14,3,5): | 59.21 | |
| TEMA (21): | 33.47 | |
| Williams %R (14): | -4.26 | |
| Chande Momentum Oscillator (20): | 0.36 | |
| Repulse (5,40,3): | 0.0800 | |
| ROCnROLL: | 1 | |
| TRIX (15,9): | 0.0200 | |
| Courbe Coppock: | 1.50 |
| MA7: | 33.19 | |
| MA20: | 33.25 | |
| MA50: | 33.13 | |
| MA100: | 34.47 | |
| MAexp7: | 33.46 | |
| MAexp20: | 33.34 | |
| MAexp50: | 33.22 | |
| MAexp100: | 33.15 | |
| Price / MA7: | +1.90% | |
| Price / MA20: | +1.71% | |
| Price / MA50: | +2.08% | |
| Price / MA100: | -1.89% | |
| Price / MAexp7: | +1.08% | |
| Price / MAexp20: | +1.44% | |
| Price / MAexp50: | +1.81% | |
| Price / MAexp100: | +2.02% |
News
Don't forget to follow the news on BEKAERT. At the time of publication of this analysis, the latest news was as follows:
- Bekaert - Update on the Share Buyback Program and the Liquidity Agreement
- Bekaert - Update on the Share Buyback Program and the Liquidity Agreement
- Bekaert - Update on the Share Buyback Program and the Liquidity Agreement
- Bekaert - Update on the Liquidity Agreement
- Bekaert - Update on the Liquidity Agreement
About author

Online


Add a comment
Comments
0 comments on the analysis BEKAERT - 1H