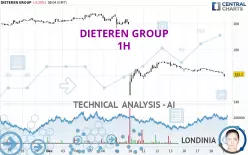
DIETEREN GROUP - 1H - Technical analysis published on 12/19/2024 (GMT)
- 79
- 0
Click here for a new analysis!
- Timeframe : 1H
- - Analysis generated on
- Status : INVALID

Summary of the analysis

Additional analysis
Quotes
DIETEREN GROUP rating 161.2 EUR. The price registered a decrease of -0.25% on the session and was between 159.2 EUR and 161.2 EUR. This implies that the price is at +1.26% from its lowest and at 0% from its highest.A bullish opening was detected by the Central Gaps scanner. Buyers are trying to impose a bullish momentum in the very short term.
Bullish opening
Type : Bullish
Timeframe : Openning
A study of price movements over other periods shows the following variations:
Near a new HIGH record (5 years)
Type : Bullish
Timeframe : Weekly
Near a new HIGH record (1 year)
Type : Bullish
Timeframe : Weekly
Near a new HIGH record (1st january)
Type : Bullish
Timeframe : Weekly
Near a new HIGH record (1 month)
Type : Bullish
Timeframe : Weekly
The Central Volumes scanner detects abnormal volumes on the asset:
Abnormal volumes
Timeframe : 20 days
Technical
Technical analysis of this 1H chart of DIETEREN GROUP indicates that the overall trend is slightly bullish. 53.57% of the signals given by moving averages are bullish. Caution: a reversal of the trend could be possible given the strong bearish signals of short-term moving averages. There is no crossing of moving average by the price or crossing of moving averages between themselves.
An assessment of technical indicators does not currently provide any relevant information to suggest whether the signal given by the technical indicators is more bullish or bearish.
But beware of excesses. The Central Indicators scanner currently detects this:
CCI indicator is oversold : under -100
Type : Neutral
Timeframe : 1 hour
Williams %R indicator is oversold : under -80
Type : Neutral
Timeframe : 1 hour
The Central Patterns scanner, which studies chart patterns, resistances and supports, has identified these signals:
Near horizontal support
Type : Bullish
Timeframe : 1 hour
Support of channel is broken
Type : Bearish
Timeframe : 1 hour
No result was found by the Central Candlesticks scanner on Japanese candlesticks.
| S3 | S2 | S1 | Price | R1 | R2 | |
|---|---|---|---|---|---|---|
| ProTrendLines | 135.8 | 142.2 | 157.4 | 161.2 | 163.0 | 169.3 |
| Change (%) | -15.76% | -11.79% | -2.36% | - | +1.12% | +5.02% |
| Change | -25.4 | -19.0 | -3.8 | - | +1.8 | +8.1 |
| Level | Minor | Major | Minor | - | Intermediate | Major |
Attention could also be paid to pivot points to set price objectives:
| Pivot points | S3 | S2 | S1 | PP | R1 | R2 | R3 |
|---|---|---|---|---|---|---|---|
| Standard | 157.5 | 159.5 | 160.6 | 162.6 | 163.7 | 165.7 | 166.8 |
| Camarilla | 160.8 | 161.0 | 161.3 | 161.6 | 161.9 | 162.2 | 162.5 |
| Woodie | 157.0 | 159.3 | 160.1 | 162.4 | 163.2 | 165.5 | 166.3 |
| Fibonacci | 159.5 | 160.7 | 161.5 | 162.6 | 163.8 | 164.6 | 165.7 |
| Pivot points | S3 | S2 | S1 | PP | R1 | R2 | R3 |
|---|---|---|---|---|---|---|---|
| Standard | 88.7 | 106.2 | 135.8 | 153.3 | 182.9 | 200.4 | 230.0 |
| Camarilla | 152.5 | 156.8 | 161.1 | 165.4 | 169.7 | 174.0 | 178.4 |
| Woodie | 94.8 | 109.2 | 141.9 | 156.3 | 189.0 | 203.4 | 236.1 |
| Fibonacci | 106.2 | 124.2 | 135.3 | 153.3 | 171.3 | 182.4 | 200.4 |
| Pivot points | S3 | S2 | S1 | PP | R1 | R2 | R3 |
|---|---|---|---|---|---|---|---|
| Standard | 109.2 | 114.2 | 120.6 | 125.6 | 132.0 | 137.0 | 143.4 |
| Camarilla | 123.8 | 124.8 | 125.9 | 126.9 | 128.0 | 129.0 | 130.0 |
| Woodie | 109.8 | 114.6 | 121.2 | 126.0 | 132.6 | 137.4 | 144.0 |
| Fibonacci | 114.2 | 118.6 | 121.3 | 125.6 | 130.0 | 132.7 | 137.0 |
Numerical data
The following is the status of the technical indicators and moving averages at the time of publication of this technical analysis:
| RSI (14): | 33.30 | |
| MACD (12,26,9): | -0.6000 | |
| Directional Movement: | -19.2 | |
| AROON (14): | -92.9 | |
| DEMA (21): | 163.0 | |
| Parabolic SAR (0,02-0,02-0,2): | 164.3 | |
| Elder Ray (13): | -1.3 | |
| Super Trend (3,10): | 164.6 | |
| Zig ZAG (10): | 161.6 | |
| VORTEX (21): | 0.9000 | |
| Stochastique (14,3,5): | 3.70 | |
| TEMA (21): | 161.5 | |
| Williams %R (14): | -100.00 | |
| Chande Momentum Oscillator (20): | -3.5 | |
| Repulse (5,40,3): | -1.0000 | |
| ROCnROLL: | -1 | |
| TRIX (15,9): | 0.0000 | |
| Courbe Coppock: | 2.40 |
| MA7: | 164.4 | |
| MA20: | 140.2 | |
| MA50: | 129.9 | |
| MA100: | 129.1 | |
| MAexp7: | 162.6 | |
| MAexp20: | 163.6 | |
| MAexp50: | 161.6 | |
| MAexp100: | 154.1 | |
| Price / MA7: | -1.95% | |
| Price / MA20: | +14.98% | |
| Price / MA50: | +24.10% | |
| Price / MA100: | +24.86% | |
| Price / MAexp7: | -0.86% | |
| Price / MAexp20: | -1.47% | |
| Price / MAexp50: | -0.25% | |
| Price / MAexp100: | +4.61% |
News
The latest news and videos published on DIETEREN GROUP at the time of the analysis were as follows:
- D'Ieteren and Clayton, Dubilier & Rice Enter Exclusive Discussions Regarding Partnership Investment in Belron
-
 D'Ieteren
About author
Online


Add a comment
Comments
0 comments on the analysis DIETEREN GROUP - 1H