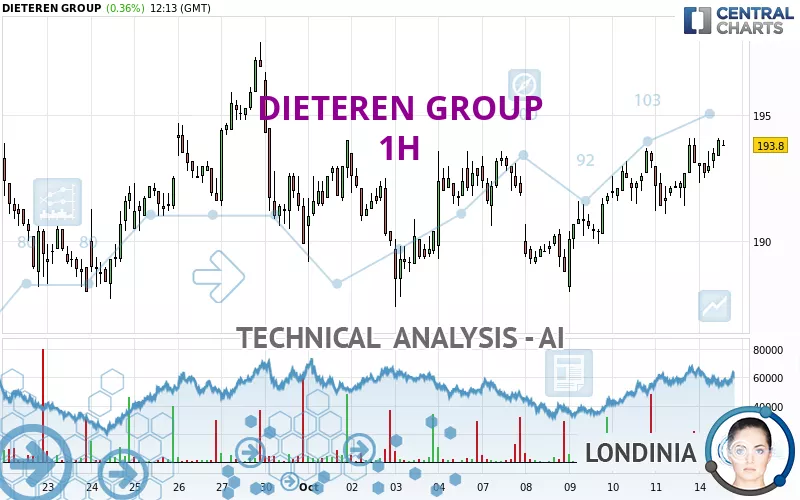
DIETEREN GROUP - 1H - Technical analysis published on 10/14/2024 (GMT)
- 122
- 0
Click here for a new analysis!
- Timeframe : 1H
- - Analysis generated on
- Status : TARGET REACHED
Summary of the analysis

Additional analysis
Quotes
DIETEREN GROUP rating 193.8 EUR. On the day, this instrument gained +0.36% and was between 192.3 EUR and 194.1 EUR. This implies that the price is at +0.78% from its lowest and at -0.15% from its highest.The Central Gaps scanner detects a bearish opening. A small advantage for sellers in the very short term.
Bearish opening
Type : Bearish
Timeframe : Openning
So that you have an overall view of the price change, here is a table showing the variations over several periods:
Near a new LOW record (1 month)
Type : Bearish
Timeframe : Weekly
Technical
A technical analysis in 1H of this DIETEREN GROUP chart shows a bullish trend. The signals returned by the moving averages are 75.00% bullish. This bullish trend is reinforced by the strong signals currently being given by short-term moving averages. There is no crossing of moving average by the price or crossing of moving averages between themselves.
The probability of a further increase is high given the direction of the technical indicators.
Caution: the Central Indicators scanner currently detects an excess:
CCI indicator is overbought : over 100
Type : Neutral
Timeframe : 1 hour
CCI indicator: bearish divergence
Type : Bearish
Timeframe : 1 hour
Williams %R indicator is overbought : over -20
Type : Neutral
Timeframe : 1 hour
The analysis of the price chart with Central Patterns scanners does not return any result.
The presence of a bearish pattern in Japanese candlesticks detected by Central Candlesticks that could cause a correction in the very short term was also detected:
Bearish harami cross
Type : Bearish
Timeframe : 1 hour
| S3 | S2 | S1 | Price | R1 | R2 | R3 | |
|---|---|---|---|---|---|---|---|
| ProTrendLines | 189.7 | 191.5 | 193.6 | 193.8 | 196.4 | 197.9 | 201.8 |
| Change (%) | -2.12% | -1.19% | -0.10% | - | +1.34% | +2.12% | +4.13% |
| Change | -4.1 | -2.3 | -0.2 | - | +2.6 | +4.1 | +8.0 |
| Level | Major | Minor | Major | - | Major | Minor | Minor |
Attention could also be paid to pivot points to set price objectives:
| Pivot points | S3 | S2 | S1 | PP | R1 | R2 | R3 |
|---|---|---|---|---|---|---|---|
| Standard | 188.4 | 189.8 | 191.4 | 192.8 | 194.4 | 195.8 | 197.4 |
| Camarilla | 192.3 | 192.6 | 192.8 | 193.1 | 193.4 | 193.7 | 193.9 |
| Woodie | 188.6 | 189.9 | 191.6 | 192.9 | 194.6 | 195.9 | 197.6 |
| Fibonacci | 189.8 | 190.9 | 191.6 | 192.8 | 193.9 | 194.6 | 195.8 |
| Pivot points | S3 | S2 | S1 | PP | R1 | R2 | R3 |
|---|---|---|---|---|---|---|---|
| Standard | 183.3 | 185.6 | 189.4 | 191.7 | 195.5 | 197.8 | 201.6 |
| Camarilla | 191.4 | 192.0 | 192.5 | 193.1 | 193.7 | 194.2 | 194.8 |
| Woodie | 184.0 | 186.0 | 190.1 | 192.1 | 196.2 | 198.2 | 202.3 |
| Fibonacci | 185.6 | 188.0 | 189.4 | 191.7 | 194.1 | 195.5 | 197.8 |
| Pivot points | S3 | S2 | S1 | PP | R1 | R2 | R3 |
|---|---|---|---|---|---|---|---|
| Standard | 134.9 | 161.3 | 175.6 | 202.0 | 216.3 | 242.7 | 257.0 |
| Camarilla | 178.7 | 182.4 | 186.2 | 189.9 | 193.6 | 197.4 | 201.1 |
| Woodie | 128.9 | 158.3 | 169.6 | 199.0 | 210.3 | 239.7 | 251.0 |
| Fibonacci | 161.3 | 176.9 | 186.5 | 202.0 | 217.6 | 227.2 | 242.7 |
Numerical data
The following is the status of the technical indicators and moving averages at the time of publication of this technical analysis:
| RSI (14): | 62.00 | |
| MACD (12,26,9): | 0.5000 | |
| Directional Movement: | 7.7 | |
| AROON (14): | 35.7 | |
| DEMA (21): | 193.5 | |
| Parabolic SAR (0,02-0,02-0,2): | 191.5 | |
| Elder Ray (13): | 0.8 | |
| Super Trend (3,10): | 191.4 | |
| Zig ZAG (10): | 193.9 | |
| VORTEX (21): | 1.1000 | |
| Stochastique (14,3,5): | 90.00 | |
| TEMA (21): | 193.8 | |
| Williams %R (14): | -6.70 | |
| Chande Momentum Oscillator (20): | 2.2 | |
| Repulse (5,40,3): | 0.4000 | |
| ROCnROLL: | 1 | |
| TRIX (15,9): | 0.0000 | |
| Courbe Coppock: | 1.00 |
| MA7: | 192.2 | |
| MA20: | 192.3 | |
| MA50: | 203.3 | |
| MA100: | 202.8 | |
| MAexp7: | 193.4 | |
| MAexp20: | 192.8 | |
| MAexp50: | 192.2 | |
| MAexp100: | 192.5 | |
| Price / MA7: | +0.83% | |
| Price / MA20: | +0.78% | |
| Price / MA50: | -4.67% | |
| Price / MA100: | -4.44% | |
| Price / MAexp7: | +0.21% | |
| Price / MAexp20: | +0.52% | |
| Price / MAexp50: | +0.83% | |
| Price / MAexp100: | +0.68% |
News
Don't forget to follow the news on DIETEREN GROUP. At the time of publication of this analysis, the latest news was as follows:
- D'Ieteren and Clayton, Dubilier & Rice Enter Exclusive Discussions Regarding Partnership Investment in Belron
-
 D'Ieteren
About author
Online


Add a comment
Comments
0 comments on the analysis DIETEREN GROUP - 1H