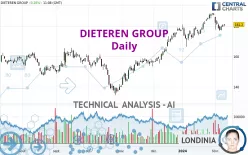
DIETEREN GROUP - Daily - Technical analysis published on 02/09/2024 (GMT)
- 135
- 0
Click here for a new analysis!
- Timeframe : Daily
- - Analysis generated on
- Status : TARGET REACHED

Summary of the analysis

Additional analysis
Quotes
The DIETEREN GROUP rating is 181.2 EUR. On the day, this instrument gained +0.28% with the lowest point at 180.0 EUR and the highest point at 181.3 EUR. The deviation from the price is +0.67% for the low point and -0.06% for the high point.Here is a more detailed summary of the historical variations registered by DIETEREN GROUP:
Near a new HIGH record (5 years)
Type : Bullish
Timeframe : Weekly
Near a new HIGH record (1 year)
Type : Bullish
Timeframe : Weekly
Near a new HIGH record (1st january)
Type : Bullish
Timeframe : Weekly
Near a new LOW record (1 month)
Type : Bearish
Timeframe : Weekly
Technical
Technical analysis of this Daily chart of DIETEREN GROUP indicates that the overall trend is strongly bullish. 85.71% of the signals given by moving averages are bullish. The slightly bullish signals given by the short-term moving averages show a weakening of the global trend. The Central Indicators market scanner is currently detecting a bullish signal that could impact this trend:
Bullish trend reversal : adaptative moving average 20
Type : Bullish
Timeframe : Daily
In fact, only 7 technical indicators out of 18 studied are currently bearish. The Central Indicators scanner specialised in technical indicators, has not detected anything further.
Central Patterns, the market scanner focusing on chart patterns, resistances and supports found this result:
Near support of channel
Type : Bullish
Timeframe : Daily
Central Candlesticks, the scanner specialised in Japanese candlesticks, detects this inversion signal that could impact the current short-term trend:
Doji
Type : Neutral
Timeframe : Daily
| S3 | S2 | S1 | Price | R1 | |
|---|---|---|---|---|---|
| ProTrendLines | 147.7 | 162.2 | 170.7 | 181.2 | 188.4 |
| Change (%) | -18.49% | -10.49% | -5.79% | - | +3.97% |
| Change | -33.5 | -19.0 | -10.5 | - | +7.2 |
| Level | Minor | Intermediate | Major | - | Major |
To determine price objectives, it is also possible to use the pivot points. Here is the price position in relation to pivot points:
| Pivot points | S3 | S2 | S1 | PP | R1 | R2 | R3 |
|---|---|---|---|---|---|---|---|
| Standard | 178.2 | 179.0 | 179.8 | 180.6 | 181.4 | 182.2 | 183.0 |
| Camarilla | 180.3 | 180.4 | 180.6 | 180.7 | 180.9 | 181.0 | 181.1 |
| Woodie | 178.3 | 179.0 | 179.9 | 180.6 | 181.5 | 182.2 | 183.1 |
| Fibonacci | 179.0 | 179.6 | 180.0 | 180.6 | 181.2 | 181.6 | 182.2 |
| Pivot points | S3 | S2 | S1 | PP | R1 | R2 | R3 |
|---|---|---|---|---|---|---|---|
| Standard | 165.7 | 171.8 | 176.6 | 182.7 | 187.5 | 193.6 | 198.4 |
| Camarilla | 178.5 | 179.5 | 180.5 | 181.5 | 182.5 | 183.5 | 184.5 |
| Woodie | 165.2 | 171.5 | 176.1 | 182.4 | 187.0 | 193.3 | 197.9 |
| Fibonacci | 171.8 | 175.9 | 178.5 | 182.7 | 186.8 | 189.4 | 193.6 |
| Pivot points | S3 | S2 | S1 | PP | R1 | R2 | R3 |
|---|---|---|---|---|---|---|---|
| Standard | 151.0 | 158.8 | 173.2 | 181.0 | 195.4 | 203.2 | 217.6 |
| Camarilla | 181.6 | 183.6 | 185.7 | 187.7 | 189.7 | 191.8 | 193.8 |
| Woodie | 154.4 | 160.5 | 176.6 | 182.7 | 198.8 | 204.9 | 221.0 |
| Fibonacci | 158.8 | 167.3 | 172.5 | 181.0 | 189.5 | 194.7 | 203.2 |
Numerical data
The following are the details of the technical indicators and moving averages that were collected to generate this technical analysis:
| RSI (14): | 53.60 | |
| MACD (12,26,9): | 1.8000 | |
| Directional Movement: | -6.1 | |
| AROON (14): | -35.7 | |
| DEMA (21): | 183.6 | |
| Parabolic SAR (0,02-0,02-0,2): | 187.0 | |
| Elder Ray (13): | -0.6 | |
| Super Trend (3,10): | 189.2 | |
| Zig ZAG (10): | 180.8 | |
| VORTEX (21): | 1.1000 | |
| Stochastique (14,3,5): | 29.70 | |
| TEMA (21): | 181.9 | |
| Williams %R (14): | -66.90 | |
| Chande Momentum Oscillator (20): | -3.4 | |
| Repulse (5,40,3): | 0.6000 | |
| ROCnROLL: | -1 | |
| TRIX (15,9): | 0.2000 | |
| Courbe Coppock: | 1.80 |
| MA7: | 180.2 | |
| MA20: | 181.6 | |
| MA50: | 174.0 | |
| MA100: | 163.1 | |
| MAexp7: | 181.0 | |
| MAexp20: | 180.5 | |
| MAexp50: | 174.5 | |
| MAexp100: | 168.4 | |
| Price / MA7: | +0.55% | |
| Price / MA20: | -0.22% | |
| Price / MA50: | +4.14% | |
| Price / MA100: | +11.10% | |
| Price / MAexp7: | +0.11% | |
| Price / MAexp20: | +0.39% | |
| Price / MAexp50: | +3.84% | |
| Price / MAexp100: | +7.60% |
News
The latest news and videos published on DIETEREN GROUP at the time of the analysis were as follows:
- D'Ieteren and Clayton, Dubilier & Rice Enter Exclusive Discussions Regarding Partnership Investment in Belron
-
 D'Ieteren
About author
Online


Add a comment
Comments
0 comments on the analysis DIETEREN GROUP - Daily