PROXIMUS - Daily - Technical analysis published on 06/27/2023 (GMT)
- 166
- 0
Click here for a new analysis!
- Timeframe : Daily
- - Analysis generated on
- Status : LEVEL MAINTAINED
Summary of the analysis

Additional analysis
Quotes
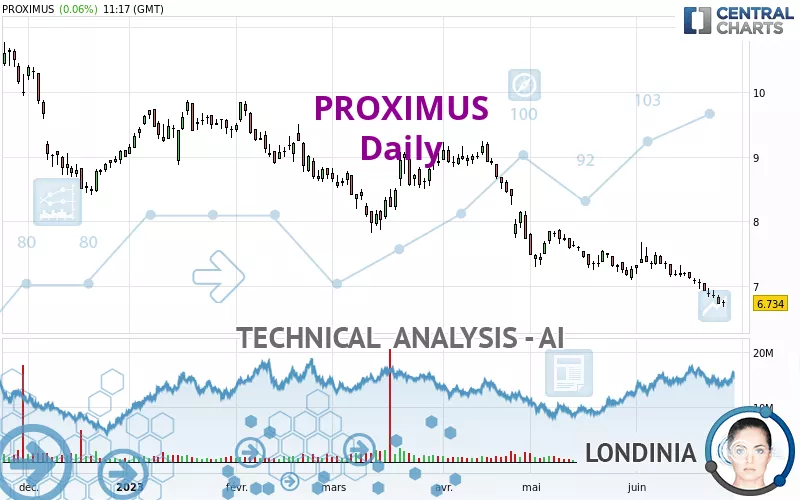
The PROXIMUS rating is 6.734 EUR. The price registered an increase of +0.06% on the session and was traded between 6.676 EUR and 6.784 EUR over the period. The price is currently at +0.87% from its lowest and -0.74% from its highest.A bullish opening was detected by the Central Gaps scanner. Buyers are trying to impose a bullish momentum in the very short term.
Bullish opening
Type : Bullish
Timeframe : Openning
Here is a more detailed summary of the historical variations registered by PROXIMUS:
New LOW record (5 years)
Type : Bearish
Timeframe : Weekly
New LOW record (1 year)
Type : Bearish
Timeframe : Weekly
New LOW record (1st january)
Type : Bearish
Timeframe : Weekly
New LOW record (1 month)
Type : Bearish
Timeframe : Weekly
Technical
A technical analysis in Daily of this PROXIMUS chart shows a sharp bearish trend. 92.86% of the signals given by moving averages are bearish. This strongly bearish trend is supported by the strong bearish signals given by short-term moving averages. There is no crossing of moving average by the price or crossing of moving averages between themselves.
Technical indicators are bearish. There is still some doubt about the decline in the price.
Caution: the Central Indicators scanner currently detects an excess:
RSI indicator is oversold : under 30
Type : Neutral
Timeframe : Daily
CCI indicator is oversold : under -100
Type : Neutral
Timeframe : Daily
CCI indicator: bullish divergence
Type : Bullish
Timeframe : Daily
Williams %R indicator is oversold : under -80
Type : Neutral
Timeframe : Daily
Pivot points : price is under support 1
Type : Neutral
Timeframe : Weekly
The Central Patterns scanner, which studies chart patterns, resistances and supports, has identified this signal:
Near horizontal resistance
Type : Bearish
Timeframe : Daily
The Central Candlesticks scanner which studies Japanese candlesticks did not detect anything.
| Price | R1 | R2 | R3 | |
|---|---|---|---|---|
| ProTrendLines | 6.734 | 7.307 | 8.522 | 9.025 |
| Change (%) | - | +8.51% | +26.55% | +34.02% |
| Change | - | +0.573 | +1.788 | +2.291 |
| Level | - | Intermediate | Intermediate | Intermediate |
Pivot points can also be used to set your price objectives. Here is the price situation in relation to pivot points:
| Pivot points | S3 | S2 | S1 | PP | R1 | R2 | R3 |
|---|---|---|---|---|---|---|---|
| Standard | 6.558 | 6.642 | 6.686 | 6.770 | 6.814 | 6.898 | 6.942 |
| Camarilla | 6.695 | 6.707 | 6.718 | 6.730 | 6.742 | 6.754 | 6.765 |
| Woodie | 6.538 | 6.632 | 6.666 | 6.760 | 6.794 | 6.888 | 6.922 |
| Fibonacci | 6.642 | 6.691 | 6.721 | 6.770 | 6.819 | 6.849 | 6.898 |
| Pivot points | S3 | S2 | S1 | PP | R1 | R2 | R3 |
|---|---|---|---|---|---|---|---|
| Standard | 6.427 | 6.623 | 6.735 | 6.931 | 7.043 | 7.239 | 7.351 |
| Camarilla | 6.763 | 6.792 | 6.820 | 6.848 | 6.876 | 6.905 | 6.933 |
| Woodie | 6.386 | 6.602 | 6.694 | 6.910 | 7.002 | 7.218 | 7.310 |
| Fibonacci | 6.623 | 6.740 | 6.813 | 6.931 | 7.048 | 7.121 | 7.239 |
| Pivot points | S3 | S2 | S1 | PP | R1 | R2 | R3 |
|---|---|---|---|---|---|---|---|
| Standard | 6.156 | 6.622 | 6.942 | 7.408 | 7.728 | 8.194 | 8.514 |
| Camarilla | 7.046 | 7.118 | 7.190 | 7.262 | 7.334 | 7.406 | 7.478 |
| Woodie | 6.083 | 6.586 | 6.869 | 7.372 | 7.655 | 8.158 | 8.441 |
| Fibonacci | 6.622 | 6.922 | 7.108 | 7.408 | 7.708 | 7.894 | 8.194 |
Numerical data
The following are the details of the technical indicators and moving averages that were collected to generate this technical analysis:
| RSI (14): | 24.79 | |
| MACD (12,26,9): | -0.1860 | |
| Directional Movement: | -18.942 | |
| AROON (14): | -100.000 | |
| DEMA (21): | 6.863 | |
| Parabolic SAR (0,02-0,02-0,2): | 7.158 | |
| Elder Ray (13): | -0.267 | |
| Super Trend (3,10): | 7.153 | |
| Zig ZAG (10): | 6.732 | |
| VORTEX (21): | 0.8240 | |
| Stochastique (14,3,5): | 3.98 | |
| TEMA (21): | 6.803 | |
| Williams %R (14): | -92.77 | |
| Chande Momentum Oscillator (20): | -0.608 | |
| Repulse (5,40,3): | -2.4900 | |
| ROCnROLL: | 2 | |
| TRIX (15,9): | -0.2860 | |
| Courbe Coppock: | 12.26 |
| MA7: | 6.897 | |
| MA20: | 7.153 | |
| MA50: | 7.440 | |
| MA100: | 7.755 | |
| MAexp7: | 6.880 | |
| MAexp20: | 7.096 | |
| MAexp50: | 7.387 | |
| MAexp100: | 7.765 | |
| Price / MA7: | -2.36% | |
| Price / MA20: | -5.86% | |
| Price / MA50: | -9.49% | |
| Price / MA100: | -13.17% | |
| Price / MAexp7: | -2.12% | |
| Price / MAexp20: | -5.10% | |
| Price / MAexp50: | -8.84% | |
| Price / MAexp100: | -13.28% |
News
Don't forget to follow the news on PROXIMUS. At the time of publication of this analysis, the latest news was as follows:
- TeleSign Expands Global Services through Partnership with Proximus
- Proximus Selects VIAVI for Fiber-to-the-Home Network Monitoring
-
 Proximus
About author
Online


Add a comment
Comments
0 comments on the analysis PROXIMUS - Daily