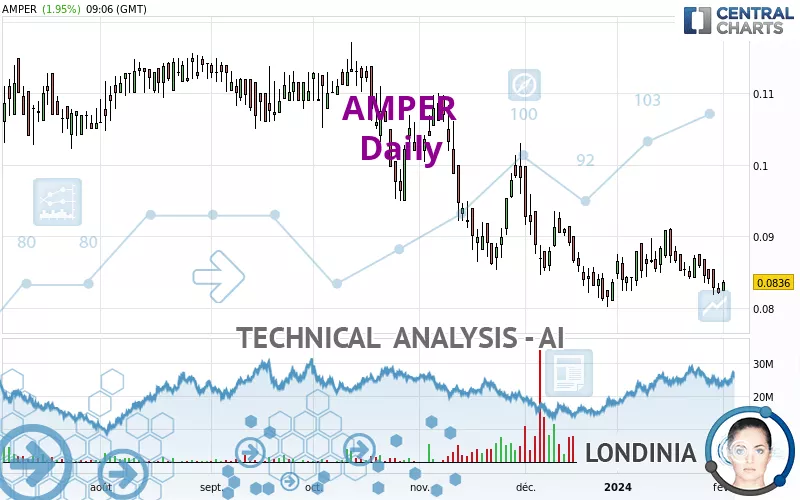
AMPER - Daily - Technical analysis published on 02/01/2024 (GMT)
- 167
- 0
Click here for a new analysis!
- Timeframe : Daily
- - Analysis generated on
- Status : TARGET REACHED
Summary of the analysis

Additional analysis
Quotes
The AMPER rating is 0.0836 EUR. The price registered an increase of +1.95% on the session and was traded between 0.0824 EUR and 0.0839 EUR over the period. The price is currently at +1.46% from its lowest and -0.36% from its highest.The Central Gaps scanner detects a bullish opening marking the presence of buyers ahead of sellers at the opening but not sufficiently marked to allow the price to register a quotation gap.
Bullish opening
Type : Bullish
Timeframe : Openning
So that you have an overall view of the price change, here is a table showing the variations over several periods:
Near a new LOW record (5 years)
Type : Bearish
Timeframe : Weekly
Near a new LOW record (1 year)
Type : Bearish
Timeframe : Weekly
Near a new LOW record (1st january)
Type : Bearish
Timeframe : Weekly
Near a new LOW record (1 month)
Type : Bearish
Timeframe : Weekly
Abnormal volumes on AMPER were detected by the Central Volumes scanner:
Abnormal volumes
Timeframe : 50 days
Technical
Technical analysis of AMPER in Daily shows a overall strongly bearish trend. The signals given by moving averages are 92.86% bearish. This strong bearish trend is confirmed by the strong signals currently being given by short-term moving averages. The Central Indicators scanner does not detect any result on moving averages that would impact this trend.
An assessment of technical indicators does not currently provide any relevant information on the direction of future price movements.
Caution: the Central Indicators scanner currently detects an excess:
CCI indicator is oversold : under -100
Type : Neutral
Timeframe : Daily
Pivot points : price is over resistance 1
Type : Neutral
Timeframe : Daily
Price is back under the pivot point
Type : Bearish
Timeframe : Weekly
The Central Patterns scanner, which studies chart patterns, resistances and supports, has identified this signal:
Near horizontal support
Type : Bullish
Timeframe : Daily
No result was found by the Central Candlesticks scanner on Japanese candlesticks.
| S1 | Price | R1 | R2 | R3 | |
|---|---|---|---|---|---|
| ProTrendLines | 0.0811 | 0.0836 | 0.1009 | 0.1091 | 0.1463 |
| Change (%) | -2.99% | - | +20.69% | +30.50% | +75.00% |
| Change | -0.0025 | - | +0.0173 | +0.0255 | +0.0627 |
| Level | Major | - | Intermediate | Intermediate | Minor |
Pivot points can also be used to set your price objectives. Here is the price situation in relation to pivot points:
| Pivot points | S3 | S2 | S1 | PP | R1 | R2 | R3 |
|---|---|---|---|---|---|---|---|
| Standard | 0.0800 | 0.0809 | 0.0815 | 0.0824 | 0.0830 | 0.0839 | 0.0845 |
| Camarilla | 0.0816 | 0.0817 | 0.0819 | 0.0820 | 0.0821 | 0.0823 | 0.0824 |
| Woodie | 0.0798 | 0.0808 | 0.0813 | 0.0823 | 0.0828 | 0.0838 | 0.0843 |
| Fibonacci | 0.0809 | 0.0815 | 0.0819 | 0.0824 | 0.0830 | 0.0834 | 0.0839 |
| Pivot points | S3 | S2 | S1 | PP | R1 | R2 | R3 |
|---|---|---|---|---|---|---|---|
| Standard | 0.0788 | 0.0811 | 0.0828 | 0.0851 | 0.0868 | 0.0891 | 0.0908 |
| Camarilla | 0.0833 | 0.0837 | 0.0840 | 0.0844 | 0.0848 | 0.0851 | 0.0855 |
| Woodie | 0.0784 | 0.0810 | 0.0824 | 0.0850 | 0.0864 | 0.0890 | 0.0904 |
| Fibonacci | 0.0811 | 0.0827 | 0.0836 | 0.0851 | 0.0867 | 0.0876 | 0.0891 |
| Pivot points | S3 | S2 | S1 | PP | R1 | R2 | R3 |
|---|---|---|---|---|---|---|---|
| Standard | 0.0694 | 0.0756 | 0.0788 | 0.0850 | 0.0882 | 0.0944 | 0.0976 |
| Camarilla | 0.0794 | 0.0803 | 0.0811 | 0.0820 | 0.0829 | 0.0837 | 0.0846 |
| Woodie | 0.0679 | 0.0749 | 0.0773 | 0.0843 | 0.0867 | 0.0937 | 0.0961 |
| Fibonacci | 0.0756 | 0.0792 | 0.0814 | 0.0850 | 0.0886 | 0.0908 | 0.0944 |
Numerical data
The following are the details of the technical indicators and moving averages that were collected to generate this technical analysis:
| RSI (14): | 45.49 | |
| MACD (12,26,9): | -0.0011 | |
| Directional Movement: | -2.7444 | |
| AROON (14): | -64.2857 | |
| DEMA (21): | 0.0838 | |
| Parabolic SAR (0,02-0,02-0,2): | 0.0879 | |
| Elder Ray (13): | -0.0015 | |
| Super Trend (3,10): | 0.0913 | |
| Zig ZAG (10): | 0.0836 | |
| VORTEX (21): | 0.9904 | |
| Stochastique (14,3,5): | 10.28 | |
| TEMA (21): | 0.0840 | |
| Williams %R (14): | -80.85 | |
| Chande Momentum Oscillator (20): | -0.0070 | |
| Repulse (5,40,3): | -2.3276 | |
| ROCnROLL: | 2 | |
| TRIX (15,9): | -0.1260 | |
| Courbe Coppock: | 5.71 |
| MA7: | 0.0842 | |
| MA20: | 0.0857 | |
| MA50: | 0.0872 | |
| MA100: | 0.0941 | |
| MAexp7: | 0.0839 | |
| MAexp20: | 0.0851 | |
| MAexp50: | 0.0879 | |
| MAexp100: | 0.0935 | |
| Price / MA7: | -0.71% | |
| Price / MA20: | -2.45% | |
| Price / MA50: | -4.13% | |
| Price / MA100: | -11.16% | |
| Price / MAexp7: | -0.36% | |
| Price / MAexp20: | -1.76% | |
| Price / MAexp50: | -4.89% | |
| Price / MAexp100: | -10.59% |
News
Don't forget to follow the news on AMPER. At the time of publication of this analysis, the latest news was as follows:
- Shutterstock Announces Acquisition of Amper Music
- Reuters Connect to offer end-to-end Productivity Suite with partners including Stringr, Amper Music and InVideo
- Amper Music Launches First AI Music Composition Platform for Enterprise Content Creators
- The Muse Acquires Brand Amper, a Brand Building Tool to Power Employment Marketing
- Amper Music Raises $4M to Launch the First Artificial Intelligence Music Composition Technology for Professionals
About author
Online


Add a comment
Comments
0 comments on the analysis AMPER - Daily