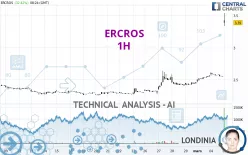
ERCROS - 1H - Technical analysis published on 03/05/2024 (GMT)
- 134
- 0
Click here for a new analysis!
- Timeframe : 1H
- - Analysis generated on
- Status : LEVEL MAINTAINED

Summary of the analysis

Additional analysis
Quotes
The ERCROS rating is 3.410 EUR. The price has increased by +33.20% since the last closing and was between 3.370 EUR and 3.540 EUR. This implies that the price is at +1.19% from its lowest and at -3.67% from its highest.The Central Gaps scanner detects a bullish gap which is a sign that buyers have taken the lead in the very short term.
Opening Gap UP
Type : Bullish
Timeframe : Openning
So that you have an overall view of the price change, here is a table showing the variations over several periods:
Near a new HIGH record (1st january)
Type : Bullish
Timeframe : Weekly
Near a new HIGH record (1 month)
Type : Bullish
Timeframe : Weekly
The Central Volumes scanner detects abnormal volumes on the asset:
Abnormal volumes
Timeframe : 5 days
Technical
Technical analysis of ERCROS in 1H shows a strongly overall bullish trend. 92.86% of the signals given by moving averages are bullish. This strongly bullish trend is supported by the strong bullish signals given by short-term moving averages. The Central Indicators scanner does not detect any result on moving averages that would impact this trend.
Technical indicators are strongly bullish, suggesting that the price increase should continue.
Caution: the Central Indicators scanner currently detects an excess:
RSI indicator is overbought : over 90
Type : Neutral
Timeframe : 1 hour
CCI indicator is overbought : over 100
Type : Neutral
Timeframe : 1 hour
Williams %R indicator is overbought : over -20
Type : Neutral
Timeframe : 1 hour
Pivot points : price is over resistance 3
Type : Neutral
Timeframe : 1 hour
Pivot points : price is over resistance 3
Type : Neutral
Timeframe : Weekly
MACD crosses UP its Moving Average
Type : Bullish
Timeframe : 1 hour
Central Patterns, the scanner specializing in chart patterns, did not identify any signals.
Central Candlesticks, the scanner specialised in Japanese candlesticks, detects a bullish signal that could support the hypothesis of a small rebound in the very short term:
Long white line
Type : Bullish
Timeframe : 1 hour
| S3 | S2 | S1 | Price | R1 | R2 | R3 | |
|---|---|---|---|---|---|---|---|
| ProTrendLines | 2.750 | 3.034 | 3.320 | 3.410 | 3.651 | 4.616 | 4.853 |
| Change (%) | -19.35% | -11.03% | -2.64% | - | +7.07% | +35.37% | +42.32% |
| Change | -0.660 | -0.376 | -0.090 | - | +0.241 | +1.206 | +1.443 |
| Level | Minor | Major | Major | - | Intermediate | Intermediate | Major |
Attention could also be paid to pivot points to set price objectives:
| Pivot points | S3 | S2 | S1 | PP | R1 | R2 | R3 |
|---|---|---|---|---|---|---|---|
| Standard | 2.463 | 2.507 | 2.533 | 2.577 | 2.603 | 2.647 | 2.673 |
| Camarilla | 2.541 | 2.547 | 2.554 | 2.560 | 2.566 | 2.573 | 2.579 |
| Woodie | 2.455 | 2.503 | 2.525 | 2.573 | 2.595 | 2.643 | 2.665 |
| Fibonacci | 2.507 | 2.533 | 2.550 | 2.577 | 2.603 | 2.620 | 2.647 |
| Pivot points | S3 | S2 | S1 | PP | R1 | R2 | R3 |
|---|---|---|---|---|---|---|---|
| Standard | 1.982 | 2.128 | 2.347 | 2.493 | 2.712 | 2.858 | 3.077 |
| Camarilla | 2.465 | 2.498 | 2.532 | 2.565 | 2.599 | 2.632 | 2.665 |
| Woodie | 2.018 | 2.146 | 2.383 | 2.511 | 2.748 | 2.876 | 3.113 |
| Fibonacci | 2.128 | 2.268 | 2.354 | 2.493 | 2.633 | 2.719 | 2.858 |
| Pivot points | S3 | S2 | S1 | PP | R1 | R2 | R3 |
|---|---|---|---|---|---|---|---|
| Standard | 1.890 | 2.075 | 2.270 | 2.455 | 2.650 | 2.835 | 3.030 |
| Camarilla | 2.361 | 2.395 | 2.430 | 2.465 | 2.500 | 2.535 | 2.570 |
| Woodie | 1.895 | 2.078 | 2.275 | 2.458 | 2.655 | 2.838 | 3.035 |
| Fibonacci | 2.075 | 2.220 | 2.310 | 2.455 | 2.600 | 2.690 | 2.835 |
Numerical data
The following are the details of the technical indicators and moving averages that were collected to generate this technical analysis:
| RSI (14): | 93.85 | |
| MACD (12,26,9): | 0.0980 | |
| Directional Movement: | 82.100 | |
| AROON (14): | 100.000 | |
| DEMA (21): | 2.740 | |
| Parabolic SAR (0,02-0,02-0,2): | 2.550 | |
| Elder Ray (13): | 0.792 | |
| Super Trend (3,10): | 3.134 | |
| Zig ZAG (10): | 3.455 | |
| VORTEX (21): | 1.0700 | |
| Stochastique (14,3,5): | 59.45 | |
| TEMA (21): | 2.801 | |
| Williams %R (14): | -11.44 | |
| Chande Momentum Oscillator (20): | 0.890 | |
| Repulse (5,40,3): | -1.9820 | |
| ROCnROLL: | 1 | |
| TRIX (15,9): | 0.2620 | |
| Courbe Coppock: | 16.11 |
| MA7: | 2.608 | |
| MA20: | 2.427 | |
| MA50: | 2.502 | |
| MA100: | 2.576 | |
| MAexp7: | 2.779 | |
| MAexp20: | 2.629 | |
| MAexp50: | 2.521 | |
| MAexp100: | 2.454 | |
| Price / MA7: | +30.75% | |
| Price / MA20: | +40.50% | |
| Price / MA50: | +36.29% | |
| Price / MA100: | +32.38% | |
| Price / MAexp7: | +22.71% | |
| Price / MAexp20: | +29.71% | |
| Price / MAexp50: | +35.26% | |
| Price / MAexp100: | +38.96% |
News
Don't forget to follow the news on ERCROS. At the time of publication of this analysis, the latest news was as follows:
About author
Online


Add a comment
Comments
0 comments on the analysis ERCROS - 1H