| Open: | 266 |
| Change: | 0 |
| Volume: | 8,936 |
| Low: | 258 |
| High: | 270 |
| High / Low range: | 12 |
| Type: | Stocks |
| Ticker: | ECR |
| ISIN: | ES0125140A14 |
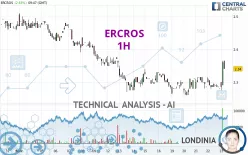
ERCROS - 1H - Technical analysis published on 02/23/2024 (GMT)
- 151
- 0
- 02/23/2024 - 10:20
Click here for a new analysis!
- Timeframe : 1H
- - Analysis generated on 02/23/2024 - 10:20
- Status : INVALID

Summary of the analysis

Additional analysis
Quotes
The ERCROS rating is 2.360 EUR. The price registered an increase of +3.51% on the session and was between 2.275 EUR and 2.365 EUR. This implies that the price is at +3.74% from its lowest and at -0.21% from its highest.The Central Gaps scanner detects a bullish opening. A small advantage for buyers in the very short term.
Bullish opening
Type : Bullish
Timeframe : Openning
So that you have an overall view of the price change, here is a table showing the variations over several periods:
Near a new LOW record (1 year)
Type : Bearish
Timeframe : Weekly
Near a new LOW record (1st january)
Type : Bearish
Timeframe : Weekly
Near a new LOW record (1 month)
Type : Bearish
Timeframe : Weekly
Technical
Technical analysis of this 1H chart of ERCROS indicates that the overall trend is bullish. 64.29% of the signals given by moving averages are bullish. This bullish trend is supported by the strong bullish signals given by short-term moving averages. The Central Indicators scanner detects bullish signals on moving averages that could impact this trend:
Moving Average bullish crossovers : MA20 & MA50
Type : Bullish
Timeframe : 1 hour
Bullish price crossover with Moving Average 20
Type : Bullish
Timeframe : 1 hour
Bullish price crossover with Moving Average 50
Type : Bullish
Timeframe : 1 hour
Bullish price crossover with Moving Average 100
Type : Bullish
Timeframe : 1 hour
Bullish price crossover with adaptative moving average 20
Type : Bullish
Timeframe : 1 hour
Bullish price crossover with adaptative moving average 50
Type : Bullish
Timeframe : 1 hour
Bullish price crossover with adaptative moving average 100
Type : Bullish
Timeframe : 1 hour
In fact, 12 technical indicators on 18 studied are currently positioned bullish. Caution: the Central Indicators scanner currently detects an excess:
CCI indicator is overbought : over 100
Type : Neutral
Timeframe : 1 hour
Williams %R indicator is overbought : over -20
Type : Neutral
Timeframe : 1 hour
Pivot points : price is over resistance 1
Type : Neutral
Timeframe : Weekly
Pivot points : price is over resistance 3
Type : Neutral
Timeframe : 1 hour
RSI indicator is back over 50
Type : Bullish
Timeframe : 1 hour
MACD crosses UP its Moving Average
Type : Bullish
Timeframe : 1 hour
Parabolic SAR indicator bullish reversal
Type : Bullish
Timeframe : 1 hour
Aroon indicator bullish trend
Type : Bullish
Timeframe : 1 hour
Ichimoku : price is over the cloud
Type : Bullish
Timeframe : 1 hour
MACD indicator is back over 0
Type : Bullish
Timeframe : 1 hour
Momentum indicator is back over 0
Type : Bullish
Timeframe : 1 hour
Central Patterns, the market scanner focusing on chart patterns, resistances and supports found this result:
Near support of channel
Type : Bullish
Timeframe : 1 hour
The presence of these bullish Japanese candlestick patterns detected by Central Candlesticks that could cause a very short term rebound were also noted:
White line without lower shadow
Type : Bullish
Timeframe : 1 hour
Long white line
Type : Bullish
Timeframe : 1 hour
| S3 | S2 | S1 | Price | R1 | R2 | R3 | |
|---|---|---|---|---|---|---|---|
| ProTrendLines | 2.025 | 2.277 | 2.315 | 2.360 | 2.425 | 2.469 | 2.540 |
| Change (%) | -14.19% | -3.52% | -1.91% | - | +2.75% | +4.62% | +7.63% |
| Change | -0.335 | -0.083 | -0.045 | - | +0.065 | +0.109 | +0.180 |
| Level | Intermediate | Intermediate | Minor | - | Minor | Intermediate | Minor |
To determine price objectives, it is also possible to use the pivot points. Here is the price position in relation to pivot points:
| Pivot points | S3 | S2 | S1 | PP | R1 | R2 | R3 |
|---|---|---|---|---|---|---|---|
| Standard | 2.233 | 2.257 | 2.268 | 2.292 | 2.303 | 2.327 | 2.338 |
| Camarilla | 2.270 | 2.274 | 2.277 | 2.280 | 2.283 | 2.286 | 2.290 |
| Woodie | 2.228 | 2.254 | 2.263 | 2.289 | 2.298 | 2.324 | 2.333 |
| Fibonacci | 2.257 | 2.270 | 2.278 | 2.292 | 2.305 | 2.313 | 2.327 |
| Pivot points | S3 | S2 | S1 | PP | R1 | R2 | R3 |
|---|---|---|---|---|---|---|---|
| Standard | 2.137 | 2.203 | 2.247 | 2.313 | 2.357 | 2.423 | 2.467 |
| Camarilla | 2.260 | 2.270 | 2.280 | 2.290 | 2.300 | 2.310 | 2.320 |
| Woodie | 2.125 | 2.198 | 2.235 | 2.308 | 2.345 | 2.418 | 2.455 |
| Fibonacci | 2.203 | 2.245 | 2.271 | 2.313 | 2.355 | 2.381 | 2.423 |
| Pivot points | S3 | S2 | S1 | PP | R1 | R2 | R3 |
|---|---|---|---|---|---|---|---|
| Standard | 2.055 | 2.245 | 2.360 | 2.550 | 2.665 | 2.855 | 2.970 |
| Camarilla | 2.391 | 2.419 | 2.447 | 2.475 | 2.503 | 2.531 | 2.559 |
| Woodie | 2.018 | 2.226 | 2.323 | 2.531 | 2.628 | 2.836 | 2.933 |
| Fibonacci | 2.245 | 2.362 | 2.434 | 2.550 | 2.667 | 2.739 | 2.855 |
Numerical data
The following is the status of technical indicators and moving averages registered at the time this technical analysis was created:
| RSI (14): | 66.95 | |
| MACD (12,26,9): | 0.0020 | |
| Directional Movement: | 29.342 | |
| AROON (14): | 7.143 | |
| DEMA (21): | 2.300 | |
| Parabolic SAR (0,02-0,02-0,2): | 2.275 | |
| Elder Ray (13): | 0.028 | |
| Super Trend (3,10): | 2.268 | |
| Zig ZAG (10): | 2.360 | |
| VORTEX (21): | 0.8190 | |
| Stochastique (14,3,5): | 39.82 | |
| TEMA (21): | 2.305 | |
| Williams %R (14): | -5.56 | |
| Chande Momentum Oscillator (20): | 0.060 | |
| Repulse (5,40,3): | 3.3820 | |
| ROCnROLL: | 1 | |
| TRIX (15,9): | -0.0070 | |
| Courbe Coppock: | 0.44 |
| MA7: | 2.308 | |
| MA20: | 2.381 | |
| MA50: | 2.507 | |
| MA100: | 2.594 | |
| MAexp7: | 2.305 | |
| MAexp20: | 2.298 | |
| MAexp50: | 2.304 | |
| MAexp100: | 2.332 | |
| Price / MA7: | +2.25% | |
| Price / MA20: | -0.88% | |
| Price / MA50: | -5.86% | |
| Price / MA100: | -9.02% | |
| Price / MAexp7: | +2.39% | |
| Price / MAexp20: | +2.70% | |
| Price / MAexp50: | +2.43% | |
| Price / MAexp100: | +1.20% |
News
The last news published on ERCROS at the time of the generation of this analysis was as follows:
-
02/13/2017 - 10:51
 Ercros
About author
Online


Add a comment
Comments
0 comments on the analysis ERCROS - 1H