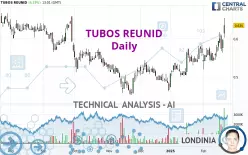
TUBOS REUNID - Daily - Technical analysis published on 02/21/2025 (GMT)
- 84
- 0
Click here for a new analysis!
- Timeframe : Daily
- - Analysis generated on
- Status : INVALID

Summary of the analysis

Additional analysis
Quotes
The TUBOS REUNID rating is 0.635 EUR. The price has increased by +6.19% since the last closing and was traded between 0.604 EUR and 0.655 EUR over the period. The price is currently at +5.13% from its lowest and -3.05% from its highest.So that you have an overall view of the price change, here is a table showing the variations over several periods:
New HIGH record (1st january)
Type : Bullish
Timeframe : Weekly
New HIGH record (1 month)
Type : Bullish
Timeframe : Weekly
Technical
Technical analysis of TUBOS REUNID in Daily shows a strongly overall bullish trend. 89.29% of the signals given by moving averages are bullish. This strongly bullish trend is supported by the strong bullish signals given by short-term moving averages. The Central Indicators scanner detects a bullish signal on moving averages that could impact this trend:
Bullish trend reversal : Moving Average 100
Type : Bullish
Timeframe : Daily
Technical indicators are strongly bullish, suggesting that the price increase should continue.
Central Indicators, the scanner specialised in technical indicators, has identified these signals:
Pivot points : price is over resistance 2
Type : Neutral
Timeframe : Daily
Pivot points : price is over resistance 3
Type : Neutral
Timeframe : Weekly
The Central Patterns scanner, which studies chart patterns, resistances and supports, has identified these signals:
Horizontal resistance is broken
Type : Bullish
Timeframe : Daily
Resistance of channel is broken
Type : Bullish
Timeframe : Daily
The presence of a bullish Japanese candlestick pattern detected by Central Candlesticks that could cause a very short term rebound was also detected:
Upside gap
Type : Bullish
Timeframe : Daily
| S3 | S2 | S1 | Price | R1 | R2 | R3 | |
|---|---|---|---|---|---|---|---|
| ProTrendLines | 0.542 | 0.573 | 0.610 | 0.635 | 0.642 | 0.687 | 0.786 |
| Change (%) | -14.65% | -9.76% | -3.94% | - | +1.10% | +8.19% | +23.78% |
| Change | -0.093 | -0.062 | -0.025 | - | +0.007 | +0.052 | +0.151 |
| Level | Major | Major | Minor | - | Intermediate | Minor | Major |
Pivot points can also be used to set your price objectives. Here is the price situation in relation to pivot points:
| Pivot points | S3 | S2 | S1 | PP | R1 | R2 | R3 |
|---|---|---|---|---|---|---|---|
| Standard | 0.540 | 0.552 | 0.575 | 0.587 | 0.610 | 0.622 | 0.645 |
| Camarilla | 0.588 | 0.592 | 0.595 | 0.598 | 0.601 | 0.604 | 0.608 |
| Woodie | 0.546 | 0.555 | 0.581 | 0.590 | 0.616 | 0.625 | 0.651 |
| Fibonacci | 0.552 | 0.565 | 0.574 | 0.587 | 0.600 | 0.609 | 0.622 |
| Pivot points | S3 | S2 | S1 | PP | R1 | R2 | R3 |
|---|---|---|---|---|---|---|---|
| Standard | 0.508 | 0.525 | 0.551 | 0.568 | 0.594 | 0.611 | 0.637 |
| Camarilla | 0.566 | 0.570 | 0.574 | 0.578 | 0.582 | 0.586 | 0.590 |
| Woodie | 0.514 | 0.527 | 0.557 | 0.570 | 0.600 | 0.613 | 0.643 |
| Fibonacci | 0.525 | 0.541 | 0.551 | 0.568 | 0.584 | 0.594 | 0.611 |
| Pivot points | S3 | S2 | S1 | PP | R1 | R2 | R3 |
|---|---|---|---|---|---|---|---|
| Standard | 0.384 | 0.428 | 0.496 | 0.540 | 0.608 | 0.652 | 0.720 |
| Camarilla | 0.533 | 0.544 | 0.554 | 0.564 | 0.574 | 0.585 | 0.595 |
| Woodie | 0.396 | 0.434 | 0.508 | 0.546 | 0.620 | 0.658 | 0.732 |
| Fibonacci | 0.428 | 0.471 | 0.497 | 0.540 | 0.583 | 0.609 | 0.652 |
Numerical data
The following is the status of the technical indicators and moving averages at the time of publication of this technical analysis:
| RSI (14): | 67.99 | |
| MACD (12,26,9): | 0.0180 | |
| Directional Movement: | 21.564 | |
| AROON (14): | 100.000 | |
| DEMA (21): | 0.595 | |
| Parabolic SAR (0,02-0,02-0,2): | 0.540 | |
| Elder Ray (13): | 0.048 | |
| Super Trend (3,10): | 0.541 | |
| Zig ZAG (10): | 0.641 | |
| VORTEX (21): | 1.1090 | |
| Stochastique (14,3,5): | 72.38 | |
| TEMA (21): | 0.603 | |
| Williams %R (14): | -17.54 | |
| Chande Momentum Oscillator (20): | 0.078 | |
| Repulse (5,40,3): | 5.4090 | |
| ROCnROLL: | 1 | |
| TRIX (15,9): | 0.3710 | |
| Courbe Coppock: | 12.08 |
| MA7: | 0.591 | |
| MA20: | 0.569 | |
| MA50: | 0.536 | |
| MA100: | 0.529 | |
| MAexp7: | 0.595 | |
| MAexp20: | 0.571 | |
| MAexp50: | 0.549 | |
| MAexp100: | 0.550 | |
| Price / MA7: | +7.45% | |
| Price / MA20: | +11.60% | |
| Price / MA50: | +18.47% | |
| Price / MA100: | +20.04% | |
| Price / MAexp7: | +6.72% | |
| Price / MAexp20: | +11.21% | |
| Price / MAexp50: | +15.66% | |
| Price / MAexp100: | +15.45% |
About author
Online


Add a comment
Comments
0 comments on the analysis TUBOS REUNID - Daily