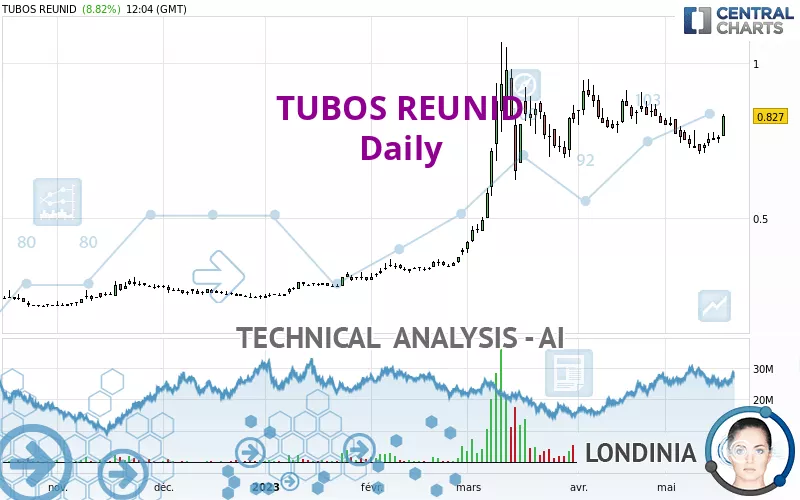
TUBOS REUNID - Daily - Technical analysis published on 05/18/2023 (GMT)
- 166
- 0
Click here for a new analysis!
- Timeframe : Daily
- - Analysis generated on
- Status : INVALID
Summary of the analysis

Additional analysis
Quotes
TUBOS REUNID rating 0.827 EUR. The price registered an increase of +8.82% on the session and was traded between 0.763 EUR and 0.836 EUR over the period. The price is currently at +8.39% from its lowest and -1.08% from its highest.The Central Gaps scanner detects a bullish opening marking the presence of buyers ahead of sellers at the opening but not sufficiently marked to allow the price to register a quotation gap.
Bullish opening
Type : Bullish
Timeframe : Openning
So that you have an overall view of the price change, here is a table showing the variations over several periods:
Abnormal volumes
Timeframe : 50 days
Technical
Technical analysis of TUBOS REUNID in Daily shows a strongly overall bullish trend. 85.71% of the signals given by moving averages are bullish. The slightly bullish signals given by the short-term moving averages indicate this trend is showing signs of running out of steam. The Central Indicators market scanner is currently detecting several bullish signals that could impact this trend:
Bullish price crossover with Moving Average 20
Type : Bullish
Timeframe : Daily
Bullish price crossover with Moving Average 50
Type : Bullish
Timeframe : Daily
Bullish price crossover with adaptative moving average 20
Type : Bullish
Timeframe : Daily
Bullish price crossover with adaptative moving average 50
Type : Bullish
Timeframe : Daily
Bullish price crossover with adaptative moving average 100
Type : Bullish
Timeframe : Daily
The probability of a further increase are moderate given the direction of the technical indicators.
Caution: the Central Indicators scanner currently detects an excess:
Williams %R indicator is overbought : over -20
Type : Neutral
Timeframe : Daily
Pivot points : price is over resistance 2
Type : Neutral
Timeframe : Weekly
Pivot points : price is over resistance 3
Type : Neutral
Timeframe : Daily
RSI indicator is back over 50
Type : Bullish
Timeframe : Daily
Ichimoku : price is over the cloud
Type : Bullish
Timeframe : Daily
Momentum indicator is back over 0
Type : Bullish
Timeframe : Daily
Central Patterns, the market scanner focusing on chart patterns, resistances and supports found these results:
Horizontal resistance is broken
Type : Bullish
Timeframe : Daily
Resistance of channel is broken
Type : Bullish
Timeframe : Daily
The Central Candlesticks scanner which studies Japanese candlesticks did not detect anything.
| S3 | S2 | S1 | Price | R1 | R2 | R3 | |
|---|---|---|---|---|---|---|---|
| ProTrendLines | 0.511 | 0.710 | 0.790 | 0.827 | 0.910 | 0.975 | 1.378 |
| Change (%) | -38.21% | -14.15% | -4.47% | - | +10.04% | +17.90% | +66.63% |
| Change | -0.316 | -0.117 | -0.037 | - | +0.083 | +0.148 | +0.551 |
| Level | Major | Major | Intermediate | - | Major | Major | Minor |
Pivot points can also be used to set your price objectives. Here is the price situation in relation to pivot points:
| Pivot points | S3 | S2 | S1 | PP | R1 | R2 | R3 |
|---|---|---|---|---|---|---|---|
| Standard | 0.721 | 0.732 | 0.746 | 0.757 | 0.771 | 0.782 | 0.796 |
| Camarilla | 0.753 | 0.755 | 0.758 | 0.760 | 0.762 | 0.765 | 0.767 |
| Woodie | 0.723 | 0.733 | 0.748 | 0.758 | 0.773 | 0.783 | 0.798 |
| Fibonacci | 0.732 | 0.742 | 0.748 | 0.757 | 0.767 | 0.773 | 0.782 |
| Pivot points | S3 | S2 | S1 | PP | R1 | R2 | R3 |
|---|---|---|---|---|---|---|---|
| Standard | 0.618 | 0.661 | 0.698 | 0.741 | 0.778 | 0.821 | 0.858 |
| Camarilla | 0.712 | 0.719 | 0.727 | 0.734 | 0.741 | 0.749 | 0.756 |
| Woodie | 0.614 | 0.660 | 0.694 | 0.740 | 0.774 | 0.820 | 0.854 |
| Fibonacci | 0.661 | 0.692 | 0.711 | 0.741 | 0.772 | 0.791 | 0.821 |
| Pivot points | S3 | S2 | S1 | PP | R1 | R2 | R3 |
|---|---|---|---|---|---|---|---|
| Standard | 0.566 | 0.670 | 0.738 | 0.842 | 0.910 | 1.014 | 1.082 |
| Camarilla | 0.758 | 0.774 | 0.789 | 0.805 | 0.821 | 0.837 | 0.852 |
| Woodie | 0.547 | 0.661 | 0.719 | 0.833 | 0.891 | 1.005 | 1.063 |
| Fibonacci | 0.670 | 0.736 | 0.777 | 0.842 | 0.908 | 0.949 | 1.014 |
Numerical data
The following are the details of the technical indicators and moving averages that were collected to generate this technical analysis:
| RSI (14): | 59.84 | |
| MACD (12,26,9): | -0.0040 | |
| Directional Movement: | 8.997 | |
| AROON (14): | -64.286 | |
| DEMA (21): | 0.777 | |
| Parabolic SAR (0,02-0,02-0,2): | 0.717 | |
| Elder Ray (13): | 0.027 | |
| Super Trend (3,10): | 0.863 | |
| Zig ZAG (10): | 0.832 | |
| VORTEX (21): | 0.9490 | |
| Stochastique (14,3,5): | 54.80 | |
| TEMA (21): | 0.745 | |
| Williams %R (14): | -2.27 | |
| Chande Momentum Oscillator (20): | 0.034 | |
| Repulse (5,40,3): | 11.0560 | |
| ROCnROLL: | 1 | |
| TRIX (15,9): | -0.1080 | |
| Courbe Coppock: | 16.80 |
| MA7: | 0.754 | |
| MA20: | 0.787 | |
| MA50: | 0.802 | |
| MA100: | 0.560 | |
| MAexp7: | 0.771 | |
| MAexp20: | 0.778 | |
| MAexp50: | 0.732 | |
| MAexp100: | 0.621 | |
| Price / MA7: | +9.68% | |
| Price / MA20: | +5.08% | |
| Price / MA50: | +3.12% | |
| Price / MA100: | +47.68% | |
| Price / MAexp7: | +7.26% | |
| Price / MAexp20: | +6.30% | |
| Price / MAexp50: | +12.98% | |
| Price / MAexp100: | +33.17% |
About author
Online


Add a comment
Comments
0 comments on the analysis TUBOS REUNID - Daily