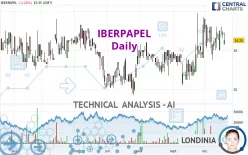
IBERPAPEL - Daily - Technical analysis published on 10/20/2023 (GMT)
- 148
- 0
Click here for a new analysis!
- Timeframe : Daily
- - Analysis generated on
- Status : INVALID

Summary of the analysis

Additional analysis
Quotes
The IBERPAPEL price is 16.25 EUR. The price registered a decrease of -1.22% on the session and was traded between 16.15 EUR and 16.45 EUR over the period. The price is currently at +0.62% from its lowest and -1.22% from its highest.The Central Gaps scanner detects the formation of a bearish gap marking the strong presence of sellers ahead of buyers at the opening. This formed a quotation gap.
Opening Gap DOWN
Type : Bearish
Timeframe : Openning
A study of price movements over other periods shows the following variations:
Near a new HIGH record (1 year)
Type : Bullish
Timeframe : Weekly
Near a new HIGH record (1st january)
Type : Bullish
Timeframe : Weekly
Near a new LOW record (1 month)
Type : Bearish
Timeframe : Weekly
Technical
Technical analysis of this Daily chart of IBERPAPEL indicates that the overall trend is strongly bullish. The signals given by moving averages are 85.71% bullish. This strongly bullish trend seems to be running out of steam given the signals being given by short-term moving averages. The Central Indicators market scanner is currently detecting a bearish signal that could impact this trend:
Bearish price crossover with Moving Average 20
Type : Bearish
Timeframe : Daily
In fact, only 7 technical indicators out of 18 studied are currently positioned bullish. Central Indicators, the detector scanner for these technical indicators has recently detected several signals:
Pivot points : price is under support 1
Type : Neutral
Timeframe : Daily
MACD crosses DOWN its Moving Average
Type : Bearish
Timeframe : Daily
Momentum indicator is back over 0
Type : Bullish
Timeframe : Daily
Williams %R indicator is back under -50
Type : Bearish
Timeframe : Daily
Central Patterns, the scanner specializing in chart patterns, did not identify any signals.
No result was found by the Central Candlesticks scanner on Japanese candlesticks.
| S3 | S2 | S1 | Price | R1 | R2 | R3 | |
|---|---|---|---|---|---|---|---|
| ProTrendLines | 15.35 | 15.79 | 16.00 | 16.25 | 16.41 | 16.65 | 19.67 |
| Change (%) | -5.54% | -2.83% | -1.54% | - | +0.98% | +2.46% | +21.05% |
| Change | -0.90 | -0.46 | -0.25 | - | +0.16 | +0.40 | +3.42 |
| Level | Intermediate | Major | Major | - | Minor | Intermediate | Major |
To determine price objectives, it is also possible to use the pivot points. Here is the price position in relation to pivot points:
| Pivot points | S3 | S2 | S1 | PP | R1 | R2 | R3 |
|---|---|---|---|---|---|---|---|
| Standard | 16.13 | 16.22 | 16.33 | 16.42 | 16.53 | 16.62 | 16.73 |
| Camarilla | 16.40 | 16.41 | 16.43 | 16.45 | 16.47 | 16.49 | 16.51 |
| Woodie | 16.15 | 16.23 | 16.35 | 16.43 | 16.55 | 16.63 | 16.75 |
| Fibonacci | 16.22 | 16.29 | 16.34 | 16.42 | 16.49 | 16.54 | 16.62 |
| Pivot points | S3 | S2 | S1 | PP | R1 | R2 | R3 |
|---|---|---|---|---|---|---|---|
| Standard | 15.05 | 15.40 | 15.90 | 16.25 | 16.75 | 17.10 | 17.60 |
| Camarilla | 16.17 | 16.24 | 16.32 | 16.40 | 16.48 | 16.56 | 16.63 |
| Woodie | 15.13 | 15.44 | 15.98 | 16.29 | 16.83 | 17.14 | 17.68 |
| Fibonacci | 15.40 | 15.73 | 15.93 | 16.25 | 16.58 | 16.78 | 17.10 |
| Pivot points | S3 | S2 | S1 | PP | R1 | R2 | R3 |
|---|---|---|---|---|---|---|---|
| Standard | 13.67 | 14.38 | 15.52 | 16.23 | 17.37 | 18.08 | 19.22 |
| Camarilla | 16.14 | 16.31 | 16.48 | 16.65 | 16.82 | 16.99 | 17.16 |
| Woodie | 13.88 | 14.49 | 15.73 | 16.34 | 17.58 | 18.19 | 19.43 |
| Fibonacci | 14.38 | 15.09 | 15.53 | 16.23 | 16.94 | 17.38 | 18.08 |
Numerical data
The following is the status of the technical indicators and moving averages at the time of publication of this technical analysis:
| RSI (14): | 52.30 | |
| MACD (12,26,9): | 0.1600 | |
| Directional Movement: | 2.17 | |
| AROON (14): | -42.86 | |
| DEMA (21): | 16.44 | |
| Parabolic SAR (0,02-0,02-0,2): | 16.77 | |
| Elder Ray (13): | -0.01 | |
| Super Trend (3,10): | 15.29 | |
| Zig ZAG (10): | 16.25 | |
| VORTEX (21): | 1.0300 | |
| Stochastique (14,3,5): | 61.33 | |
| TEMA (21): | 16.50 | |
| Williams %R (14): | -52.38 | |
| Chande Momentum Oscillator (20): | 0.15 | |
| Repulse (5,40,3): | 2.1800 | |
| ROCnROLL: | -1 | |
| TRIX (15,9): | 0.1500 | |
| Courbe Coppock: | 3.46 |
| MA7: | 16.41 | |
| MA20: | 16.25 | |
| MA50: | 15.91 | |
| MA100: | 15.80 | |
| MAexp7: | 16.37 | |
| MAexp20: | 16.22 | |
| MAexp50: | 16.00 | |
| MAexp100: | 15.81 | |
| Price / MA7: | -0.98% | |
| Price / MA20: | -0% | |
| Price / MA50: | +2.14% | |
| Price / MA100: | +2.85% | |
| Price / MAexp7: | -0.73% | |
| Price / MAexp20: | +0.18% | |
| Price / MAexp50: | +1.56% | |
| Price / MAexp100: | +2.78% |
News
The latest news and videos published on IBERPAPEL at the time of the analysis were as follows:
About author
Online


Add a comment
Comments
0 comments on the analysis IBERPAPEL - Daily