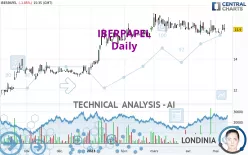
IBERPAPEL - Daily - Technical analysis published on 05/11/2023 (GMT)
- 146
- 0
Click here for a new analysis!
- Timeframe : Daily
- - Analysis generated on
- Status : TARGET REACHED

Summary of the analysis

Additional analysis
Quotes
The IBERPAPEL rating is 15.90 EUR. The price registered a decrease of -1.85% on the session and was traded between 15.75 EUR and 16.25 EUR over the period. The price is currently at +0.95% from its lowest and -2.15% from its highest.So that you have an overall view of the price change, here is a table showing the variations over several periods:
Near a new HIGH record (1 year)
Type : Bullish
Timeframe : Weekly
Near a new HIGH record (1st january)
Type : Bullish
Timeframe : Weekly
Near a new HIGH record (1 month)
Type : Bullish
Timeframe : Weekly
Technical
Technical analysis of this Daily chart of IBERPAPEL indicates that the overall trend is bullish. 78.57% of the signals given by moving averages are bullish. The overall trend seems to be showing some signs of weakness, as do the tentative bullish signals given by short-term moving averages. An assessment of moving averages reveals a bearish signal that could impact this trend:
Bearish price crossover with Moving Average 50
Type : Bearish
Timeframe : Daily
An assessment of technical indicators shows a slightly bullish signal.
Other results related to technical indicators were also found by the Central Indicators scanner:
Pivot points : price is over resistance 1
Type : Neutral
Timeframe : Weekly
Pivot points : price is under support 1
Type : Neutral
Timeframe : Daily
Ichimoku - Bearish crossover : Tenkan & Kijun
Type : Bearish
Timeframe : Daily
Williams %R indicator is back under -50
Type : Bearish
Timeframe : Daily
The Central Patterns scanner, which studies chart patterns, resistances and supports, has identified this signal:
Near support of triangle
Type : Bullish
Timeframe : Daily
The presence of a bearish pattern in Japanese candlesticks detected by Central Candlesticks that could cause a correction in the very short term was also detected:
Bearish harami
Type : Bearish
Timeframe : Daily
| S3 | S2 | S1 | Price | R1 | R2 | R3 | |
|---|---|---|---|---|---|---|---|
| ProTrendLines | 13.38 | 14.59 | 15.62 | 15.90 | 16.17 | 16.55 | 17.44 |
| Change (%) | -15.85% | -8.24% | -1.76% | - | +1.70% | +4.09% | +9.69% |
| Change | -2.52 | -1.31 | -0.28 | - | +0.27 | +0.65 | +1.54 |
| Level | Intermediate | Major | Intermediate | - | Intermediate | Minor | Intermediate |
Pivot points can also be used to set your price objectives. Here is the price situation in relation to pivot points:
| Pivot points | S3 | S2 | S1 | PP | R1 | R2 | R3 |
|---|---|---|---|---|---|---|---|
| Standard | 15.62 | 15.73 | 15.97 | 16.08 | 16.32 | 16.43 | 16.67 |
| Camarilla | 16.10 | 16.14 | 16.17 | 16.20 | 16.23 | 16.26 | 16.30 |
| Woodie | 15.68 | 15.76 | 16.03 | 16.11 | 16.38 | 16.46 | 16.73 |
| Fibonacci | 15.73 | 15.87 | 15.95 | 16.08 | 16.22 | 16.30 | 16.43 |
| Pivot points | S3 | S2 | S1 | PP | R1 | R2 | R3 |
|---|---|---|---|---|---|---|---|
| Standard | 15.18 | 15.42 | 15.53 | 15.77 | 15.88 | 16.12 | 16.23 |
| Camarilla | 15.55 | 15.59 | 15.62 | 15.65 | 15.68 | 15.71 | 15.75 |
| Woodie | 15.13 | 15.39 | 15.48 | 15.74 | 15.83 | 16.09 | 16.18 |
| Fibonacci | 15.42 | 15.55 | 15.63 | 15.77 | 15.90 | 15.98 | 16.12 |
| Pivot points | S3 | S2 | S1 | PP | R1 | R2 | R3 |
|---|---|---|---|---|---|---|---|
| Standard | 14.40 | 14.95 | 15.40 | 15.95 | 16.40 | 16.95 | 17.40 |
| Camarilla | 15.58 | 15.67 | 15.76 | 15.85 | 15.94 | 16.03 | 16.13 |
| Woodie | 14.35 | 14.93 | 15.35 | 15.93 | 16.35 | 16.93 | 17.35 |
| Fibonacci | 14.95 | 15.33 | 15.57 | 15.95 | 16.33 | 16.57 | 16.95 |
Numerical data
The following is the status of technical indicators and moving averages registered at the time this technical analysis was created:
| RSI (14): | 50.25 | |
| MACD (12,26,9): | -0.0300 | |
| Directional Movement: | 18.58 | |
| AROON (14): | 7.14 | |
| DEMA (21): | 15.84 | |
| Parabolic SAR (0,02-0,02-0,2): | 15.65 | |
| Elder Ray (13): | 0.14 | |
| Super Trend (3,10): | 15.23 | |
| Zig ZAG (10): | 15.90 | |
| VORTEX (21): | 0.9100 | |
| Stochastique (14,3,5): | 41.67 | |
| TEMA (21): | 15.79 | |
| Williams %R (14): | -60.00 | |
| Chande Momentum Oscillator (20): | 0.05 | |
| Repulse (5,40,3): | -0.0700 | |
| ROCnROLL: | 1 | |
| TRIX (15,9): | -0.0400 | |
| Courbe Coppock: | 0.85 |
| MA7: | 15.82 | |
| MA20: | 15.86 | |
| MA50: | 16.03 | |
| MA100: | 15.30 | |
| MAexp7: | 15.87 | |
| MAexp20: | 15.88 | |
| MAexp50: | 15.79 | |
| MAexp100: | 15.34 | |
| Price / MA7: | +0.51% | |
| Price / MA20: | +0.25% | |
| Price / MA50: | -0.81% | |
| Price / MA100: | +3.92% | |
| Price / MAexp7: | +0.19% | |
| Price / MAexp20: | +0.13% | |
| Price / MAexp50: | +0.70% | |
| Price / MAexp100: | +3.65% |
News
Don't forget to follow the news on IBERPAPEL. At the time of publication of this analysis, the latest news was as follows:
About author
Online


Add a comment
Comments
0 comments on the analysis IBERPAPEL - Daily