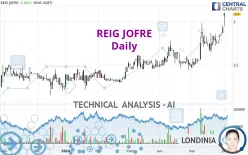
REIG JOFRE - Daily - Technical analysis published on 06/03/2024 (GMT)
- 159
- 0
Click here for a new analysis!
- Timeframe : Daily
- - Analysis generated on
- Status : INVALID

Summary of the analysis

Additional analysis
Quotes
REIG JOFRE rating 3.10 EUR. On the day, this instrument gained +5.80% with the lowest point at 2.95 EUR and the highest point at 3.10 EUR. The deviation from the price is +5.08% for the low point and 0% for the high point.A bullish gap was detected at the opening by the Central Gaps scanner. There are a lot of buyers and they have the upper hand in the very short term.
Opening Gap UP
Type : Bullish
Timeframe : Openning
So that you have an overall view of the price change, here is a table showing the variations over several periods:
New HIGH record (1 year)
Type : Bullish
Timeframe : Weekly
New HIGH record (1st january)
Type : Bullish
Timeframe : Weekly
New HIGH record (1 month)
Type : Bullish
Timeframe : Weekly
The Central Volumes scanner detects abnormal volumes on the asset:
Abnormal volumes
Timeframe : 5 days
Abnormal volumes
Timeframe : 20 days
Technical
A technical analysis in Daily of this REIG JOFRE chart shows a strongly bullish trend. 92.86% of the signals given by moving averages are bullish. The overall trend is supported by the strong bullish signals from short-term moving averages. There is no crossing of moving average by the price or crossing of moving averages between themselves.
In fact, 16 technical indicators on 18 studied are currently positioned bullish. But beware of excesses. The Central Indicators scanner currently detects this:
RSI indicator is overbought : over 70
Type : Neutral
Timeframe : Daily
CCI indicator is overbought : over 100
Type : Neutral
Timeframe : Daily
Williams %R indicator is overbought : over -20
Type : Neutral
Timeframe : Daily
Pivot points : price is over resistance 2
Type : Neutral
Timeframe : Weekly
Pivot points : price is over resistance 3
Type : Neutral
Timeframe : Daily
An analysis of the price chart with the Central Patterns scanner (detector of chart patterns and resistances and supports) shows a result that can have an impact on the price change:
Resistance of channel is broken
Type : Bullish
Timeframe : Daily
No result was found by the Central Candlesticks scanner on Japanese candlesticks.
| S3 | S2 | S1 | Price | R1 | R2 | R3 | |
|---|---|---|---|---|---|---|---|
| ProTrendLines | 2.43 | 2.65 | 2.78 | 3.10 | 3.39 | 4.35 | 5.04 |
| Change (%) | -21.61% | -14.52% | -10.32% | - | +9.35% | +40.32% | +62.58% |
| Change | -0.67 | -0.45 | -0.32 | - | +0.29 | +1.25 | +1.94 |
| Level | Major | Minor | Major | - | Minor | Minor | Minor |
Pivot points can also be used to set your price objectives. Here is the price situation in relation to pivot points:
| Pivot points | S3 | S2 | S1 | PP | R1 | R2 | R3 |
|---|---|---|---|---|---|---|---|
| Standard | 2.79 | 2.83 | 2.88 | 2.92 | 2.97 | 3.01 | 3.06 |
| Camarilla | 2.91 | 2.91 | 2.92 | 2.93 | 2.94 | 2.95 | 2.96 |
| Woodie | 2.80 | 2.83 | 2.89 | 2.92 | 2.98 | 3.01 | 3.07 |
| Fibonacci | 2.83 | 2.86 | 2.89 | 2.92 | 2.95 | 2.98 | 3.01 |
| Pivot points | S3 | S2 | S1 | PP | R1 | R2 | R3 |
|---|---|---|---|---|---|---|---|
| Standard | 2.59 | 2.67 | 2.80 | 2.88 | 3.01 | 3.09 | 3.22 |
| Camarilla | 2.87 | 2.89 | 2.91 | 2.93 | 2.95 | 2.97 | 2.99 |
| Woodie | 2.62 | 2.68 | 2.83 | 2.89 | 3.04 | 3.10 | 3.25 |
| Fibonacci | 2.67 | 2.75 | 2.80 | 2.88 | 2.96 | 3.01 | 3.09 |
| Pivot points | S3 | S2 | S1 | PP | R1 | R2 | R3 |
|---|---|---|---|---|---|---|---|
| Standard | 2.06 | 2.24 | 2.59 | 2.77 | 3.12 | 3.30 | 3.65 |
| Camarilla | 2.78 | 2.83 | 2.88 | 2.93 | 2.98 | 3.03 | 3.08 |
| Woodie | 2.14 | 2.28 | 2.67 | 2.81 | 3.20 | 3.34 | 3.73 |
| Fibonacci | 2.24 | 2.45 | 2.57 | 2.77 | 2.98 | 3.10 | 3.30 |
Numerical data
The following is the status of technical indicators and moving averages registered at the time this technical analysis was created:
| RSI (14): | 78.33 | |
| MACD (12,26,9): | 0.1000 | |
| Directional Movement: | 31.91 | |
| AROON (14): | 64.29 | |
| DEMA (21): | 2.89 | |
| Parabolic SAR (0,02-0,02-0,2): | 2.66 | |
| Elder Ray (13): | 0.20 | |
| Super Trend (3,10): | 2.73 | |
| Zig ZAG (10): | 3.10 | |
| VORTEX (21): | 1.1500 | |
| Stochastique (14,3,5): | 88.73 | |
| TEMA (21): | 2.95 | |
| Williams %R (14): | 0.00 | |
| Chande Momentum Oscillator (20): | 0.40 | |
| Repulse (5,40,3): | 5.8300 | |
| ROCnROLL: | 1 | |
| TRIX (15,9): | 0.4300 | |
| Courbe Coppock: | 16.71 |
| MA7: | 2.86 | |
| MA20: | 2.75 | |
| MA50: | 2.60 | |
| MA100: | 2.48 | |
| MAexp7: | 2.90 | |
| MAexp20: | 2.77 | |
| MAexp50: | 2.64 | |
| MAexp100: | 2.54 | |
| Price / MA7: | +8.39% | |
| Price / MA20: | +12.73% | |
| Price / MA50: | +19.23% | |
| Price / MA100: | +25.00% | |
| Price / MAexp7: | +6.90% | |
| Price / MAexp20: | +11.91% | |
| Price / MAexp50: | +17.42% | |
| Price / MAexp100: | +22.05% |
News
Don't forget to follow the news on REIG JOFRE. At the time of publication of this analysis, the latest news was as follows:
About author
Online


Add a comment
Comments
0 comments on the analysis REIG JOFRE - Daily