| Open: | - |
| Change: | - |
| Volume: | - |
| Low: | - |
| High: | - |
| High / Low range: | - |
| Type: | Stocks |
| Ticker: | MDF |
| ISIN: | ES0162600003 |
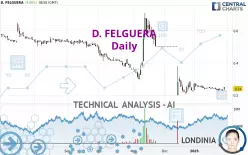
D. FELGUERA - Daily - Technical analysis published on 01/30/2025 (GMT)
- 94
- 0
- 01/30/2025 - 09:35
Click here for a new analysis!
- Timeframe : Daily
- - Analysis generated on 01/30/2025 - 09:35
- Status : INVALID

Summary of the analysis

Additional analysis
Quotes
The D. FELGUERA rating is 0.2400 EUR. The price registered an increase of +4.80% on the session with the lowest point at 0.2305 EUR and the highest point at 0.2495 EUR. The deviation from the price is +4.12% for the low point and -3.81% for the high point.The Central Gaps scanner detects the formation of a bullish gap marking the strong presence of buyers against sellers at the opening. This formed a quotation gap.
Opening Gap UP
Type : Bullish
Timeframe : Openning
Here is a more detailed summary of the historical variations registered by D. FELGUERA:
New LOW record (1st january)
Type : Bearish
Timeframe : Weekly
Near a new LOW record (1st january)
Type : Bearish
Timeframe : Weekly
New LOW record (1 month)
Type : Bearish
Timeframe : Weekly
The Central Volumes scanner detects abnormal volumes on the asset:
Abnormal volumes
Timeframe : 50 days
Technical
Technical analysis of this Daily chart of D. FELGUERA indicates that the overall trend is strongly bearish. 92.86% of the signals given by moving averages are bearish. The overall trend is supported by the strong bearish signals from short-term moving averages. There is no crossing of moving average by the price or crossing of moving averages between themselves.
On the 18 technical indicators analysed, 7 are bullish, 7 are neutral and 4 are bearish. But beware of excesses. The Central Indicators scanner currently detects this:
RSI indicator: bullish divergence
Type : Bullish
Timeframe : Daily
Williams %R indicator is overbought : over -20
Type : Neutral
Timeframe : Daily
Pivot points : price is over resistance 2
Type : Neutral
Timeframe : Daily
The Central Patterns scanner, which studies chart patterns, resistances and supports, has identified this signal:
Resistance of channel is broken
Type : Bullish
Timeframe : Daily
No result was found by the Central Candlesticks scanner on Japanese candlesticks.
| S1 | Price | R1 | R2 | R3 | |
|---|---|---|---|---|---|
| ProTrendLines | 0.1852 | 0.2400 | 0.3150 | 0.5039 | 0.6299 |
| Change (%) | -22.83% | - | +31.25% | +109.96% | +162.46% |
| Change | -0.0548 | - | +0.0750 | +0.2639 | +0.3899 |
| Level | Major | - | Minor | Major | Major |
Attention could also be paid to pivot points to set price objectives:
| Pivot points | S3 | S2 | S1 | PP | R1 | R2 | R3 |
|---|---|---|---|---|---|---|---|
| Standard | 0.2163 | 0.2217 | 0.2253 | 0.2307 | 0.2343 | 0.2397 | 0.2433 |
| Camarilla | 0.2265 | 0.2274 | 0.2282 | 0.2290 | 0.2298 | 0.2307 | 0.2315 |
| Woodie | 0.2155 | 0.2213 | 0.2245 | 0.2303 | 0.2335 | 0.2393 | 0.2425 |
| Fibonacci | 0.2217 | 0.2251 | 0.2272 | 0.2307 | 0.2341 | 0.2362 | 0.2397 |
| Pivot points | S3 | S2 | S1 | PP | R1 | R2 | R3 |
|---|---|---|---|---|---|---|---|
| Standard | 0.2093 | 0.2187 | 0.2288 | 0.2382 | 0.2483 | 0.2577 | 0.2678 |
| Camarilla | 0.2336 | 0.2354 | 0.2372 | 0.2390 | 0.2408 | 0.2426 | 0.2444 |
| Woodie | 0.2098 | 0.2189 | 0.2293 | 0.2384 | 0.2488 | 0.2579 | 0.2683 |
| Fibonacci | 0.2187 | 0.2261 | 0.2307 | 0.2382 | 0.2456 | 0.2502 | 0.2577 |
| Pivot points | S3 | S2 | S1 | PP | R1 | R2 | R3 |
|---|---|---|---|---|---|---|---|
| Standard | -0.1867 | 0.0067 | 0.1173 | 0.3107 | 0.4213 | 0.6147 | 0.7253 |
| Camarilla | 0.1444 | 0.1723 | 0.2001 | 0.2280 | 0.2559 | 0.2837 | 0.3116 |
| Woodie | -0.2280 | -0.0140 | 0.0760 | 0.2900 | 0.3800 | 0.5940 | 0.6840 |
| Fibonacci | 0.0067 | 0.1228 | 0.1945 | 0.3107 | 0.4268 | 0.4985 | 0.6147 |
Numerical data
The following is the status of technical indicators and moving averages registered at the time this technical analysis was created:
| RSI (14): | 38.97 | |
| MACD (12,26,9): | -0.0237 | |
| Directional Movement: | -9.3950 | |
| AROON (14): | -92.8571 | |
| DEMA (21): | 0.2141 | |
| Parabolic SAR (0,02-0,02-0,2): | 0.4726 | |
| Elder Ray (13): | -0.0005 | |
| Super Trend (3,10): | 0.2703 | |
| Zig ZAG (10): | 0.2400 | |
| VORTEX (21): | 1.0134 | |
| Stochastique (14,3,5): | 27.59 | |
| TEMA (21): | 0.2270 | |
| Williams %R (14): | -43.48 | |
| Chande Momentum Oscillator (20): | -0.0025 | |
| Repulse (5,40,3): | -4.6395 | |
| ROCnROLL: | -1 | |
| TRIX (15,9): | -1.5291 | |
| Courbe Coppock: | 10.55 |
| MA7: | 0.2352 | |
| MA20: | 0.2433 | |
| MA50: | 0.3419 | |
| MA100: | 0.4003 | |
| MAexp7: | 0.2365 | |
| MAexp20: | 0.2511 | |
| MAexp50: | 0.3116 | |
| MAexp100: | 0.3785 | |
| Price / MA7: | +2.04% | |
| Price / MA20: | -1.36% | |
| Price / MA50: | -29.80% | |
| Price / MA100: | -40.04% | |
| Price / MAexp7: | +1.48% | |
| Price / MAexp20: | -4.42% | |
| Price / MAexp50: | -22.98% | |
| Price / MAexp100: | -36.59% |
About author
Online


Add a comment
Comments
0 comments on the analysis D. FELGUERA - Daily