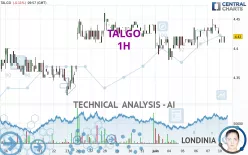
TALGO - 1H - Technical analysis published on 06/10/2024 (GMT)
- 122
- 0
- Timeframe : 1H
- - Analysis generated on
- Status : NEUTRAL

Summary of the analysis

Additional analysis
Quotes
TALGO rating 4.420 EUR. On the day, this instrument lost -0.11% and was traded between 4.410 EUR and 4.420 EUR over the period. The price is currently at +0.23% from its lowest and 0% from its highest.The Central Gaps scanner detects a bearish opening. A small advantage for sellers in the very short term.
Bearish opening
Type : Bearish
Timeframe : Openning
A study of price movements over other periods shows the following variations:
Near a new LOW record (1 month)
Type : Bearish
Timeframe : Weekly
Technical
A technical analysis in 1H of this TALGO chart shows a slightly bullish trend. 50.00% of the signals given by moving averages are bullish. As the signals currently given by short-term moving averages are rather neutral, the slightly bullish trend could return to neutral. The Central Indicators market scanner is currently detecting several bearish and bullish signals that could impact this trend:
Bearish trend reversal : adaptative moving average 50
Type : Bearish
Timeframe : 1 hour
Bullish price crossover with Moving Average 50
Type : Bullish
Timeframe : 1 hour
Technical indicators are slightly bearish. There is therefore considerable uncertainty about the continuation of the decline.
Caution: the Central Indicators scanner currently detects an excess:
CCI indicator is oversold : under -100
Type : Neutral
Timeframe : 1 hour
Ichimoku : price is over the cloud
Type : Bullish
Timeframe : 1 hour
Price is back over the pivot point
Type : Bullish
Timeframe : Weekly
An analysis of the price chart with the Central Patterns scanner (detector of chart patterns and resistances and supports) shows several results that can have an impact on the price change:
Near horizontal support
Type : Bullish
Timeframe : 1 hour
Support of channel is broken
Type : Bearish
Timeframe : 1 hour
There is also a Japanese candlestick pattern detected by Central Candlesticks that could mark the end of the current short-term trend:
Doji
Type : Neutral
Timeframe : 1 hour
| S3 | S2 | S1 | Price | R1 | R2 | R3 | |
|---|---|---|---|---|---|---|---|
| ProTrendLines | 4.350 | 4.380 | 4.420 | 4.420 | 4.432 | 4.460 | 4.595 |
| Change (%) | -1.58% | -0.90% | 0% | - | +0.27% | +0.90% | +3.96% |
| Change | -0.070 | -0.040 | 0 | - | +0.012 | +0.040 | +0.175 |
| Level | Minor | Intermediate | Major | - | Major | Intermediate | Minor |
Attention could also be paid to pivot points to set price objectives:
| Pivot points | S3 | S2 | S1 | PP | R1 | R2 | R3 |
|---|---|---|---|---|---|---|---|
| Standard | 4.358 | 4.382 | 4.403 | 4.427 | 4.448 | 4.472 | 4.493 |
| Camarilla | 4.413 | 4.417 | 4.421 | 4.425 | 4.429 | 4.433 | 4.437 |
| Woodie | 4.358 | 4.381 | 4.403 | 4.426 | 4.448 | 4.471 | 4.493 |
| Fibonacci | 4.382 | 4.399 | 4.410 | 4.427 | 4.444 | 4.455 | 4.472 |
| Pivot points | S3 | S2 | S1 | PP | R1 | R2 | R3 |
|---|---|---|---|---|---|---|---|
| Standard | 4.317 | 4.348 | 4.387 | 4.418 | 4.457 | 4.488 | 4.527 |
| Camarilla | 4.406 | 4.412 | 4.419 | 4.425 | 4.431 | 4.438 | 4.444 |
| Woodie | 4.320 | 4.350 | 4.390 | 4.420 | 4.460 | 4.490 | 4.530 |
| Fibonacci | 4.348 | 4.375 | 4.392 | 4.418 | 4.445 | 4.462 | 4.488 |
| Pivot points | S3 | S2 | S1 | PP | R1 | R2 | R3 |
|---|---|---|---|---|---|---|---|
| Standard | 4.213 | 4.267 | 4.353 | 4.407 | 4.493 | 4.547 | 4.633 |
| Camarilla | 4.402 | 4.414 | 4.427 | 4.440 | 4.453 | 4.466 | 4.479 |
| Woodie | 4.230 | 4.275 | 4.370 | 4.415 | 4.510 | 4.555 | 4.650 |
| Fibonacci | 4.267 | 4.320 | 4.353 | 4.407 | 4.460 | 4.493 | 4.547 |
Numerical data
The following are the details of the technical indicators and moving averages that were collected to generate this technical analysis:
| RSI (14): | 46.51 | |
| MACD (12,26,9): | 0.0020 | |
| Directional Movement: | -11.767 | |
| AROON (14): | 21.429 | |
| DEMA (21): | 4.429 | |
| Parabolic SAR (0,02-0,02-0,2): | 4.449 | |
| Elder Ray (13): | -0.012 | |
| Super Trend (3,10): | 4.404 | |
| Zig ZAG (10): | 4.420 | |
| VORTEX (21): | 0.9590 | |
| Stochastique (14,3,5): | 33.33 | |
| TEMA (21): | 4.430 | |
| Williams %R (14): | -66.67 | |
| Chande Momentum Oscillator (20): | -0.010 | |
| Repulse (5,40,3): | 0.1660 | |
| ROCnROLL: | 2 | |
| TRIX (15,9): | 0.0130 | |
| Courbe Coppock: | 0.02 |
| MA7: | 4.424 | |
| MA20: | 4.404 | |
| MA50: | 4.392 | |
| MA100: | 4.363 | |
| MAexp7: | 4.424 | |
| MAexp20: | 4.426 | |
| MAexp50: | 4.422 | |
| MAexp100: | 4.417 | |
| Price / MA7: | -0.09% | |
| Price / MA20: | +0.36% | |
| Price / MA50: | +0.64% | |
| Price / MA100: | +1.31% | |
| Price / MAexp7: | -0.09% | |
| Price / MAexp20: | -0.14% | |
| Price / MAexp50: | -0.05% | |
| Price / MAexp100: | +0.07% |
News
The last news published on TALGO at the time of the generation of this analysis was as follows:
About author
Online


Add a comment
Comments
0 comments on the analysis TALGO - 1H