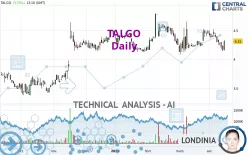
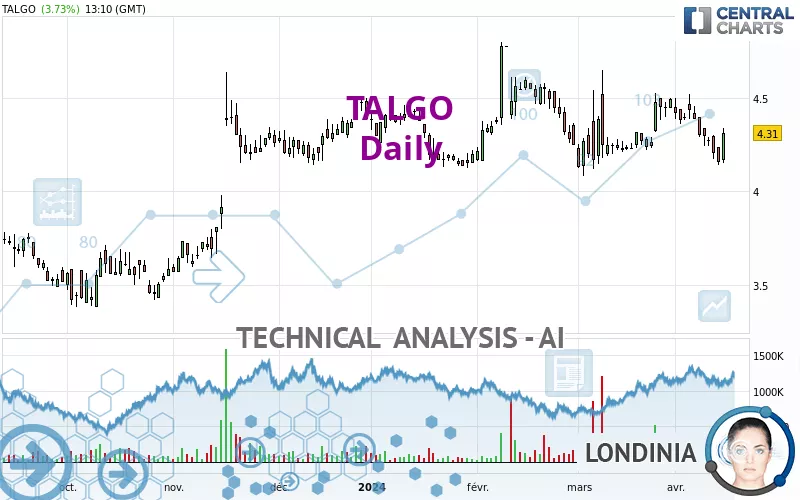
TALGO - Daily - Technical analysis published on 04/16/2024 (GMT)
- 127
- 0
- Timeframe : Daily
- - Analysis generated on
- Status : NEUTRAL
Summary of the analysis

Additional analysis
Quotes
The TALGO price is 4.310 EUR. The price has increased by +3.73% since the last closing with the lowest point at 4.150 EUR and the highest point at 4.340 EUR. The deviation from the price is +3.86% for the low point and -0.69% for the high point.The Central Gaps scanner detects a bullish opening. A small advantage for buyers in the very short term.
Bullish opening
Type : Bullish
Timeframe : Openning
So that you have an overall view of the price change, here is a table showing the variations over several periods:
Near a new LOW record (1st january)
Type : Bearish
Timeframe : Weekly
Near a new HIGH record (1 month)
Type : Bullish
Timeframe : Weekly
Technical
Technical analysis of this Daily chart of TALGO indicates that the overall trend is not clearly defined. The slightly bearish signals currently given by short-term moving averages could allow the overall trend to return to a slightly bearish trend. The Central Indicators scanner detects bullish and bearish signals on moving averages that could impact this trend:
Bearish trend reversal : Moving Average 50
Type : Bearish
Timeframe : Daily
Bullish price crossover with adaptative moving average 100
Type : Bullish
Timeframe : Daily
In fact, of the 18 technical indicators analysed by Central Analyzer, 7 are bullish, 5 are neutral and 6 are bearish. But beware of excesses. The Central Indicators scanner currently detects this:
MACD indicator: bullish divergence
Type : Bullish
Timeframe : Daily
Pivot points : price is over resistance 2
Type : Neutral
Timeframe : Daily
Price is back over the pivot point
Type : Bullish
Timeframe : Weekly
The Central Patterns scanner, which studies chart patterns, resistances and supports, has identified this signal:
Near support of channel
Type : Bullish
Timeframe : Daily
No result was found by the Central Candlesticks scanner on Japanese candlesticks.
| S3 | S2 | S1 | Price | R1 | R2 | R3 | |
|---|---|---|---|---|---|---|---|
| ProTrendLines | 3.699 | 3.924 | 4.133 | 4.310 | 4.432 | 4.780 | 4.928 |
| Change (%) | -14.18% | -8.96% | -4.11% | - | +2.83% | +10.90% | +14.34% |
| Change | -0.611 | -0.386 | -0.177 | - | +0.122 | +0.470 | +0.618 |
| Level | Major | Intermediate | Major | - | Major | Minor | Intermediate |
To determine price objectives, it is also possible to use the pivot points. Here is the price position in relation to pivot points:
| Pivot points | S3 | S2 | S1 | PP | R1 | R2 | R3 |
|---|---|---|---|---|---|---|---|
| Standard | 4.017 | 4.078 | 4.117 | 4.178 | 4.217 | 4.278 | 4.317 |
| Camarilla | 4.128 | 4.137 | 4.146 | 4.155 | 4.164 | 4.173 | 4.183 |
| Woodie | 4.005 | 4.073 | 4.105 | 4.173 | 4.205 | 4.273 | 4.305 |
| Fibonacci | 4.078 | 4.117 | 4.140 | 4.178 | 4.217 | 4.240 | 4.278 |
| Pivot points | S3 | S2 | S1 | PP | R1 | R2 | R3 |
|---|---|---|---|---|---|---|---|
| Standard | 3.822 | 3.998 | 4.102 | 4.278 | 4.382 | 4.558 | 4.662 |
| Camarilla | 4.128 | 4.154 | 4.179 | 4.205 | 4.231 | 4.256 | 4.282 |
| Woodie | 3.785 | 3.980 | 4.065 | 4.260 | 4.345 | 4.540 | 4.625 |
| Fibonacci | 3.998 | 4.105 | 4.171 | 4.278 | 4.385 | 4.451 | 4.558 |
| Pivot points | S3 | S2 | S1 | PP | R1 | R2 | R3 |
|---|---|---|---|---|---|---|---|
| Standard | 3.597 | 3.838 | 4.167 | 4.408 | 4.737 | 4.978 | 5.307 |
| Camarilla | 4.338 | 4.391 | 4.443 | 4.495 | 4.547 | 4.600 | 4.652 |
| Woodie | 3.640 | 3.860 | 4.210 | 4.430 | 4.780 | 5.000 | 5.350 |
| Fibonacci | 3.838 | 4.056 | 4.191 | 4.408 | 4.626 | 4.761 | 4.978 |
Numerical data
The following is the status of the technical indicators and moving averages at the time of publication of this technical analysis:
| RSI (14): | 49.22 | |
| MACD (12,26,9): | -0.0210 | |
| Directional Movement: | 4.138 | |
| AROON (14): | -92.857 | |
| DEMA (21): | 4.295 | |
| Parabolic SAR (0,02-0,02-0,2): | 4.506 | |
| Elder Ray (13): | -0.058 | |
| Super Trend (3,10): | 4.492 | |
| Zig ZAG (10): | 4.310 | |
| VORTEX (21): | 0.9270 | |
| Stochastique (14,3,5): | 19.07 | |
| TEMA (21): | 4.277 | |
| Williams %R (14): | -55.26 | |
| Chande Momentum Oscillator (20): | -0.135 | |
| Repulse (5,40,3): | 0.6700 | |
| ROCnROLL: | -1 | |
| TRIX (15,9): | -0.0070 | |
| Courbe Coppock: | 2.78 |
| MA7: | 4.274 | |
| MA20: | 4.336 | |
| MA50: | 4.371 | |
| MA100: | 4.327 | |
| MAexp7: | 4.277 | |
| MAexp20: | 4.316 | |
| MAexp50: | 4.320 | |
| MAexp100: | 4.233 | |
| Price / MA7: | +0.84% | |
| Price / MA20: | -0.60% | |
| Price / MA50: | -1.40% | |
| Price / MA100: | -0.39% | |
| Price / MAexp7: | +0.77% | |
| Price / MAexp20: | -0.14% | |
| Price / MAexp50: | -0.23% | |
| Price / MAexp100: | +1.82% |
News
The latest news and videos published on TALGO at the time of the analysis were as follows:
About author
Online


Add a comment
Comments
0 comments on the analysis TALGO - Daily