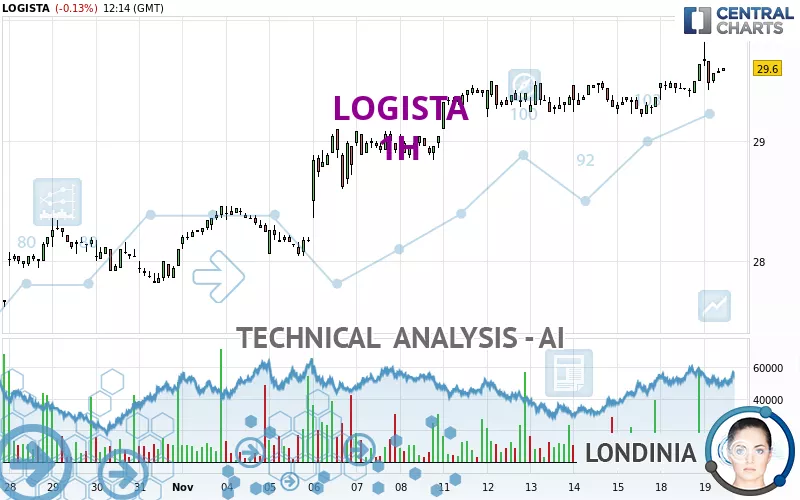
LOGISTA - 1H - Technical analysis published on 11/19/2024 (GMT)
- 82
- 0
Click here for a new analysis!
- Timeframe : 1H
- - Analysis generated on
- Status : TARGET REACHED

Summary of the analysis

Additional analysis
Quotes
The LOGISTA price is 29.60 EUR. The price registered a decrease of -0.14% on the session with the lowest point at 29.42 EUR and the highest point at 29.82 EUR. The deviation from the price is +0.61% for the low point and -0.74% for the high point.A bullish gap was detected at the opening by the Central Gaps scanner. There are a lot of buyers and they have the upper hand in the very short term.
Opening Gap UP
Type : Bullish
Timeframe : Openning
A study of price movements over other periods shows the following variations:
New HIGH record (5 years)
Type : Bullish
Timeframe : Weekly
New HIGH record (1 year)
Type : Bullish
Timeframe : Weekly
New HIGH record (1st january)
Type : Bullish
Timeframe : Weekly
New HIGH record (1 month)
Type : Bullish
Timeframe : Weekly
Technical
A technical analysis in 1H of this LOGISTA chart shows a strongly bullish trend. 92.86% of the signals given by moving averages are bullish. The overall trend is supported by the strong bullish signals from short-term moving averages. The Central Indicators market scanner currently does not detect any result that concerns moving averages.
The probability of a further increase is high given the direction of the technical indicators.
Central Indicators, the scanner specialised in technical indicators, has identified this signal:
Pivot points : price is over resistance 1
Type : Neutral
Timeframe : Weekly
An analysis of the price chart with the Central Patterns scanner (detector of chart patterns and resistances and supports) shows a result that can have an impact on the price change:
Near horizontal support
Type : Bullish
Timeframe : 1 hour
The Central Candlesticks scanner, specialised in Japanese candlesticks, did not identify any signals.
| S3 | S2 | S1 | Price | |
|---|---|---|---|---|
| ProTrendLines | 28.03 | 28.84 | 29.40 | 29.60 |
| Change (%) | -5.30% | -2.57% | -0.68% | - |
| Change | -1.57 | -0.76 | -0.20 | - |
| Level | Minor | Minor | Intermediate | - |
To determine price objectives, it is also possible to use the pivot points. Here is the price position in relation to pivot points:
| Pivot points | S3 | S2 | S1 | PP | R1 | R2 | R3 |
|---|---|---|---|---|---|---|---|
| Standard | 29.14 | 29.24 | 29.44 | 29.54 | 29.74 | 29.84 | 30.04 |
| Camarilla | 29.56 | 29.59 | 29.61 | 29.64 | 29.67 | 29.70 | 29.72 |
| Woodie | 29.19 | 29.27 | 29.49 | 29.57 | 29.79 | 29.87 | 30.09 |
| Fibonacci | 29.24 | 29.36 | 29.43 | 29.54 | 29.66 | 29.73 | 29.84 |
| Pivot points | S3 | S2 | S1 | PP | R1 | R2 | R3 |
|---|---|---|---|---|---|---|---|
| Standard | 28.74 | 28.92 | 29.14 | 29.32 | 29.54 | 29.72 | 29.94 |
| Camarilla | 29.25 | 29.29 | 29.32 | 29.36 | 29.40 | 29.43 | 29.47 |
| Woodie | 28.76 | 28.93 | 29.16 | 29.33 | 29.56 | 29.73 | 29.96 |
| Fibonacci | 28.92 | 29.07 | 29.17 | 29.32 | 29.47 | 29.57 | 29.72 |
| Pivot points | S3 | S2 | S1 | PP | R1 | R2 | R3 |
|---|---|---|---|---|---|---|---|
| Standard | 25.12 | 25.82 | 26.96 | 27.66 | 28.80 | 29.50 | 30.64 |
| Camarilla | 27.59 | 27.76 | 27.93 | 28.10 | 28.27 | 28.44 | 28.61 |
| Woodie | 25.34 | 25.93 | 27.18 | 27.77 | 29.02 | 29.61 | 30.86 |
| Fibonacci | 25.82 | 26.52 | 26.96 | 27.66 | 28.36 | 28.80 | 29.50 |
Numerical data
The following are the details of the technical indicators and moving averages that were collected to generate this technical analysis:
| RSI (14): | 59.36 | |
| MACD (12,26,9): | 0.0600 | |
| Directional Movement: | 8.42 | |
| AROON (14): | 78.57 | |
| DEMA (21): | 29.55 | |
| Parabolic SAR (0,02-0,02-0,2): | 29.42 | |
| Elder Ray (13): | 0.07 | |
| Super Trend (3,10): | 29.43 | |
| Zig ZAG (10): | 29.56 | |
| VORTEX (21): | 1.1800 | |
| Stochastique (14,3,5): | 50.62 | |
| TEMA (21): | 29.56 | |
| Williams %R (14): | -48.15 | |
| Chande Momentum Oscillator (20): | 0.08 | |
| Repulse (5,40,3): | -0.0300 | |
| ROCnROLL: | 1 | |
| TRIX (15,9): | 0.0200 | |
| Courbe Coppock: | 1.48 |
| MA7: | 29.43 | |
| MA20: | 28.67 | |
| MA50: | 27.89 | |
| MA100: | 27.36 | |
| MAexp7: | 29.54 | |
| MAexp20: | 29.47 | |
| MAexp50: | 29.34 | |
| MAexp100: | 29.08 | |
| Price / MA7: | +0.58% | |
| Price / MA20: | +3.24% | |
| Price / MA50: | +6.13% | |
| Price / MA100: | +8.19% | |
| Price / MAexp7: | +0.20% | |
| Price / MAexp20: | +0.44% | |
| Price / MAexp50: | +0.89% | |
| Price / MAexp100: | +1.79% |
About author
Online


Add a comment
Comments
0 comments on the analysis LOGISTA - 1H