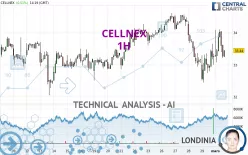
CELLNEX - 1H - Technical analysis published on 03/01/2024 (GMT)
- 157
- 0
Click here for a new analysis!
- Timeframe : 1H
- - Analysis generated on
- Status : INVALID

Summary of the analysis

Additional analysis
Quotes
CELLNEX rating 33.26 EUR. On the day, this instrument lost -0.03% and was traded between 33.07 EUR and 34.10 EUR over the period. The price is currently at +0.57% from its lowest and -2.46% from its highest.A study of price movements over other periods shows the following variations:
Near a new LOW record (1st january)
Type : Bearish
Timeframe : Weekly
Near a new LOW record (1 month)
Type : Bearish
Timeframe : Weekly
The Central Volumes scanner detects abnormal volumes on the asset:
Abnormal volumes
Timeframe : 5 days
Technical
Technical analysis of CELLNEX in 1H shows an overall bearish trend. 67.86% of the signals given by moving averages are bearish. Caution: as the signals currently given by short-term moving averages are rather neutral, the bearish trend could slow down. The Central Indicators market scanner is currently detecting several bearish and bullish signals that could impact this trend:
Bearish trend reversal : adaptative moving average 20
Type : Bearish
Timeframe : 1 hour
Bullish price crossover with adaptative moving average 20
Type : Bullish
Timeframe : 1 hour
In fact, of the 18 technical indicators analysed by Central Analyzer, 5 are bullish, 7 are neutral and 6 are bearish. Central Indicators, the scanner specialised in technical indicators, has identified this signal:
Price is back under the pivot point
Type : Bearish
Timeframe : Weekly
Central Patterns, the market scanner focusing on chart patterns, resistances and supports found this result:
Near resistance of channel
Type : Bearish
Timeframe : 1 hour
No result was found by the Central Candlesticks scanner on Japanese candlesticks.
| S3 | S2 | S1 | Price | R1 | R2 | R3 | |
|---|---|---|---|---|---|---|---|
| ProTrendLines | 32.05 | 32.48 | 32.89 | 33.26 | 33.50 | 33.96 | 34.61 |
| Change (%) | -3.64% | -2.35% | -1.11% | - | +0.72% | +2.10% | +4.06% |
| Change | -1.21 | -0.78 | -0.37 | - | +0.24 | +0.70 | +1.35 |
| Level | Minor | Major | Major | - | Intermediate | Intermediate | Intermediate |
Attention could also be paid to pivot points to set price objectives:
| Pivot points | S3 | S2 | S1 | PP | R1 | R2 | R3 |
|---|---|---|---|---|---|---|---|
| Standard | 31.40 | 31.92 | 32.60 | 33.12 | 33.80 | 34.32 | 35.00 |
| Camarilla | 32.94 | 33.05 | 33.16 | 33.27 | 33.38 | 33.49 | 33.60 |
| Woodie | 31.47 | 31.96 | 32.67 | 33.16 | 33.87 | 34.36 | 35.07 |
| Fibonacci | 31.92 | 32.38 | 32.67 | 33.12 | 33.58 | 33.87 | 34.32 |
| Pivot points | S3 | S2 | S1 | PP | R1 | R2 | R3 |
|---|---|---|---|---|---|---|---|
| Standard | 31.24 | 31.87 | 33.01 | 33.64 | 34.78 | 35.41 | 36.55 |
| Camarilla | 33.66 | 33.83 | 33.99 | 34.15 | 34.31 | 34.48 | 34.64 |
| Woodie | 31.50 | 32.00 | 33.27 | 33.77 | 35.04 | 35.54 | 36.81 |
| Fibonacci | 31.87 | 32.55 | 32.96 | 33.64 | 34.32 | 34.73 | 35.41 |
| Pivot points | S3 | S2 | S1 | PP | R1 | R2 | R3 |
|---|---|---|---|---|---|---|---|
| Standard | 27.36 | 29.70 | 31.49 | 33.83 | 35.62 | 37.96 | 39.75 |
| Camarilla | 32.13 | 32.51 | 32.89 | 33.27 | 33.65 | 34.03 | 34.41 |
| Woodie | 27.08 | 29.56 | 31.21 | 33.69 | 35.34 | 37.82 | 39.47 |
| Fibonacci | 29.70 | 31.28 | 32.26 | 33.83 | 35.41 | 36.39 | 37.96 |
Numerical data
The following is the status of the technical indicators and moving averages at the time of publication of this technical analysis:
| RSI (14): | 45.44 | |
| MACD (12,26,9): | -0.0600 | |
| Directional Movement: | 0.82 | |
| AROON (14): | 78.57 | |
| DEMA (21): | 33.32 | |
| Parabolic SAR (0,02-0,02-0,2): | 34.08 | |
| Elder Ray (13): | -0.13 | |
| Super Trend (3,10): | 32.74 | |
| Zig ZAG (10): | 33.26 | |
| VORTEX (21): | 0.9800 | |
| Stochastique (14,3,5): | 52.14 | |
| TEMA (21): | 33.38 | |
| Williams %R (14): | -61.76 | |
| Chande Momentum Oscillator (20): | 0.24 | |
| Repulse (5,40,3): | -1.0600 | |
| ROCnROLL: | 2 | |
| TRIX (15,9): | -0.0600 | |
| Courbe Coppock: | 2.91 |
| MA7: | 33.79 | |
| MA20: | 33.49 | |
| MA50: | 34.50 | |
| MA100: | 33.18 | |
| MAexp7: | 33.44 | |
| MAexp20: | 33.43 | |
| MAexp50: | 33.57 | |
| MAexp100: | 33.64 | |
| Price / MA7: | -1.57% | |
| Price / MA20: | -0.69% | |
| Price / MA50: | -3.59% | |
| Price / MA100: | +0.24% | |
| Price / MAexp7: | -0.54% | |
| Price / MAexp20: | -0.51% | |
| Price / MAexp50: | -0.92% | |
| Price / MAexp100: | -1.13% |
News
The last news published on CELLNEX at the time of the generation of this analysis was as follows:
- EQS-Adhoc: CELLNEX TELECOM S.A.: Optional Redemption Notice
- EQS-Adhoc: CELLNEX TELECOM S.A.: The company announces the final terms and conditions of the convertible bond issuance and the repurchase of convertible bonds.
- EQS-Adhoc: CELLNEX TELECOM S.A.: The company announces certain final terms and conditions of the convertible bond issue.
- EQS-Adhoc: The company announces information regarding the issuance of a convertible bond and the repurchase of convertible bonds
- Phoenix Tower International to acquire over 3,200 towers from Cellnex Telecom in France
About author
Online


Add a comment
Comments
0 comments on the analysis CELLNEX - 1H