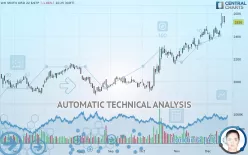
WH SMITH ORD 22 6/67P - Daily - Technical analysis published on 12/17/2019 (GMT)
- 349
- 0
- Who voted?
Click here for a new analysis!
- Timeframe : Daily
- - Analysis generated on
- Status : LEVEL MAINTAINED

Summary of the analysis

Additional analysis
Quotes
The WH SMITH ORD 22 6/67P price is 2,526 GBX. The price is lower by -1.87% since the last closing and was traded between 2,512 GBX and 2,576 GBX over the period. The price is currently at +0.56% from its lowest and -1.94% from its highest.The Central Gaps scanner detects a bullish opening. A small advantage for buyers in the very short term.
Bullish opening
Type : Bullish
Timeframe : Openning
Here is a more detailed summary of the historical variations registered by WH SMITH ORD 22 6/67P:
Near a new HIGH record (5 years)
Type : Bullish
Timeframe : Weekly
Near a new HIGH record (1st january)
Type : Bullish
Timeframe : Weekly
Near a new HIGH record (1 month)
Type : Bullish
Timeframe : Weekly
Technical
Technical analysis of WH SMITH ORD 22 6/67P in Daily shows a strongly overall bullish trend. 92.86% of the signals given by moving averages are bullish. The overall trend is supported by the strong bullish signals from short-term moving averages. There is no crossing of moving average by the price or crossing of moving averages between themselves.
An assessment of technical indicators shows a strong bullish signal.
Caution: the Central Indicators scanner currently detects an excess:
RSI indicator is overbought : over 70
Type : Neutral
Timeframe : Daily
CCI indicator is overbought : over 100
Type : Neutral
Timeframe : Daily
Williams %R indicator is overbought : over -20
Type : Neutral
Timeframe : Daily
Pivot points : price is under support 1
Type : Neutral
Timeframe : Daily
MACD crosses UP its Moving Average
Type : Bullish
Timeframe : Daily
Price is back over the pivot point
Type : Bullish
Timeframe : Weekly
The Central Patterns scanner, which studies chart patterns, resistances and supports, has identified this signal:
Near resistance of channel
Type : Bearish
Timeframe : Daily
The Central Candlesticks scanner which studies Japanese candlesticks did not detect anything.
| S3 | S2 | S1 | Price | |
|---|---|---|---|---|
| ProTrendLines | 2,186 | 2,339 | 2,472 | 2,526 |
| Change (%) | -13.46% | -7.40% | -2.14% | - |
| Change | -340 | -187 | -54 | - |
| Level | Minor | Major | Intermediate | - |
Attention could also be paid to pivot points to set price objectives:
| Pivot points | S3 | S2 | S1 | PP | R1 | R2 | R3 |
|---|---|---|---|---|---|---|---|
| Standard | 2,468 | 2,490 | 2,532 | 2,554 | 2,596 | 2,618 | 2,660 |
| Camarilla | 2,556 | 2,562 | 2,568 | 2,574 | 2,580 | 2,586 | 2,592 |
| Woodie | 2,478 | 2,495 | 2,542 | 2,559 | 2,606 | 2,623 | 2,670 |
| Fibonacci | 2,490 | 2,514 | 2,530 | 2,554 | 2,578 | 2,594 | 2,618 |
| Pivot points | S3 | S2 | S1 | PP | R1 | R2 | R3 |
|---|---|---|---|---|---|---|---|
| Standard | 2,191 | 2,293 | 2,401 | 2,503 | 2,611 | 2,713 | 2,821 |
| Camarilla | 2,452 | 2,472 | 2,491 | 2,510 | 2,529 | 2,549 | 2,568 |
| Woodie | 2,195 | 2,295 | 2,405 | 2,505 | 2,615 | 2,715 | 2,825 |
| Fibonacci | 2,293 | 2,373 | 2,422 | 2,503 | 2,583 | 2,632 | 2,713 |
| Pivot points | S3 | S2 | S1 | PP | R1 | R2 | R3 |
|---|---|---|---|---|---|---|---|
| Standard | 1,951 | 2,067 | 2,257 | 2,373 | 2,563 | 2,679 | 2,869 |
| Camarilla | 2,364 | 2,392 | 2,420 | 2,448 | 2,476 | 2,504 | 2,532 |
| Woodie | 1,989 | 2,086 | 2,295 | 2,392 | 2,601 | 2,698 | 2,907 |
| Fibonacci | 2,067 | 2,184 | 2,256 | 2,373 | 2,490 | 2,562 | 2,679 |
Numerical data
The following is the status of the technical indicators and moving averages at the time of publication of this technical analysis:
| RSI (14): | 63.00 | |
| MACD (12,26,9): | 59.0000 | |
| Directional Movement: | 26 | |
| AROON (14): | 57 | |
| DEMA (21): | 2,506 | |
| Parabolic SAR (0,02-0,02-0,2): | 2,430 | |
| Elder Ray (13): | 86 | |
| Super Trend (3,10): | 2,356 | |
| Zig ZAG (10): | 2,520 | |
| VORTEX (21): | 1.0000 | |
| Stochastique (14,3,5): | 72.00 | |
| TEMA (21): | 2,510 | |
| Williams %R (14): | -34.00 | |
| Chande Momentum Oscillator (20): | 70 | |
| Repulse (5,40,3): | -2.0000 | |
| ROCnROLL: | 1 | |
| TRIX (15,9): | 0.0000 | |
| Courbe Coppock: | 7.00 |
| MA7: | 2,478 | |
| MA20: | 2,428 | |
| MA50: | 2,305 | |
| MA100: | 2,149 | |
| MAexp7: | 2,489 | |
| MAexp20: | 2,428 | |
| MAexp50: | 2,319 | |
| MAexp100: | 2,214 | |
| Price / MA7: | +1.94% | |
| Price / MA20: | +4.04% | |
| Price / MA50: | +9.59% | |
| Price / MA100: | +17.54% | |
| Price / MAexp7: | +1.49% | |
| Price / MAexp20: | +4.04% | |
| Price / MAexp50: | +8.93% | |
| Price / MAexp100: | +14.09% |
About author

Online


Add a comment
Comments
0 comments on the analysis WH SMITH ORD 22 6/67P - Daily