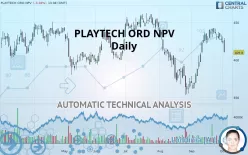
PLAYTECH ORD NPV - Daily - Technical analysis published on 10/02/2019 (GMT)
- 332
- 0
- Who voted?
- Timeframe : Daily
- - Analysis generated on
- Status : NEUTRAL

Summary of the analysis

Additional analysis
Quotes
PLAYTECH ORD NPV rating 409.8 GBX. The price is lower by -3.28% since the last closing and was traded between 409.8 GBX and 428.8 GBX over the period. The price is currently at 0% from its lowest and -4.43% from its highest.The Central Gaps scanner detects a bullish opening marking the presence of buyers ahead of sellers at the opening but not sufficiently marked to allow the price to register a quotation gap.
Bullish opening
Type : Bullish
Timeframe : Openning
So that you have an overall view of the price change, here is a table showing the variations over several periods:
Near a new HIGH record (1 month)
Type : Bullish
Timeframe : Weekly
Technical
Technical analysis of this Daily chart of PLAYTECH ORD NPV indicates that the overall trend is slightly bullish. 53.57% of the signals given by moving averages are bullish. As the signals currently given by short-term moving averages are rather neutral, the slightly bullish trend could return to neutral. There is no crossing of moving average by the price or crossing of moving averages between themselves.
In fact, Central Analyzer took into account 18 technical indicators and the result was as follows: 4 are bullish, 9 are neutral and 5 are bearish. Central Indicators, the detector scanner for these technical indicators has recently detected several signals:
Pivot points : price is under support 3
Type : Neutral
Timeframe : Daily
Pivot points : price is under support 3
Type : Neutral
Timeframe : Weekly
Momentum indicator is back under 0
Type : Bearish
Timeframe : Daily
Williams %R indicator is back under -50
Type : Bearish
Timeframe : Daily
An analysis of the price chart with the Central Patterns scanner (detector of chart patterns and resistances and supports) shows several results that can have an impact on the price change:
Near horizontal support
Type : Bullish
Timeframe : Daily
Near support of channel
Type : Bullish
Timeframe : Daily
No result was found by the Central Candlesticks scanner on Japanese candlesticks.
| S3 | S2 | S1 | Price | R1 | R2 | R3 | |
|---|---|---|---|---|---|---|---|
| ProTrendLines | 361.7 | 379.3 | 389.2 | 409.8 | 409.9 | 444.1 | 457.7 |
| Change (%) | -11.74% | -7.44% | -5.03% | - | +0.02% | +8.37% | +11.69% |
| Change | -48.1 | -30.5 | -20.6 | - | +0.1 | +34.3 | +47.9 |
| Level | Major | Intermediate | Intermediate | - | Major | Major | Minor |
To determine price objectives, it is also possible to use the pivot points. Here is the price position in relation to pivot points:
| Pivot points | S3 | S2 | S1 | PP | R1 | R2 | R3 |
|---|---|---|---|---|---|---|---|
| Standard | 411.4 | 416.7 | 420.2 | 425.5 | 429.0 | 434.3 | 437.8 |
| Camarilla | 421.3 | 422.1 | 422.9 | 423.7 | 424.5 | 425.3 | 426.1 |
| Woodie | 410.5 | 416.3 | 419.3 | 425.1 | 428.1 | 433.9 | 436.9 |
| Fibonacci | 416.7 | 420.1 | 422.1 | 425.5 | 428.9 | 430.9 | 434.3 |
| Pivot points | S3 | S2 | S1 | PP | R1 | R2 | R3 |
|---|---|---|---|---|---|---|---|
| Standard | 408.2 | 417.2 | 424.1 | 433.1 | 440.0 | 449.0 | 455.9 |
| Camarilla | 426.6 | 428.1 | 429.5 | 431.0 | 432.5 | 433.9 | 435.4 |
| Woodie | 407.2 | 416.7 | 423.1 | 432.6 | 439.0 | 448.5 | 454.9 |
| Fibonacci | 417.2 | 423.3 | 427.0 | 433.1 | 439.2 | 442.9 | 449.0 |
| Pivot points | S3 | S2 | S1 | PP | R1 | R2 | R3 |
|---|---|---|---|---|---|---|---|
| Standard | 289.8 | 323.4 | 374.9 | 408.5 | 460.0 | 493.6 | 545.1 |
| Camarilla | 403.0 | 410.8 | 418.6 | 426.4 | 434.2 | 442.0 | 449.8 |
| Woodie | 298.7 | 327.9 | 383.8 | 413.0 | 469.0 | 498.1 | 554.1 |
| Fibonacci | 323.4 | 355.9 | 376.0 | 408.5 | 441.0 | 461.1 | 493.6 |
Numerical data
The following are the details of the technical indicators and moving averages that were collected to generate this technical analysis:
| RSI (14): | 47.60 | |
| MACD (12,26,9): | 7.9000 | |
| Directional Movement: | -0.8 | |
| AROON (14): | -50.0 | |
| DEMA (21): | 429.0 | |
| Parabolic SAR (0,02-0,02-0,2): | 440.9 | |
| Elder Ray (13): | -2.9 | |
| Super Trend (3,10): | 402.2 | |
| Zig ZAG (10): | 412.0 | |
| VORTEX (21): | 1.2000 | |
| Stochastique (14,3,5): | 29.40 | |
| TEMA (21): | 435.4 | |
| Williams %R (14): | -98.40 | |
| Chande Momentum Oscillator (20): | -9.3 | |
| Repulse (5,40,3): | -6.0000 | |
| ROCnROLL: | -1 | |
| TRIX (15,9): | 0.4000 | |
| Courbe Coppock: | 12.20 |
| MA7: | 427.5 | |
| MA20: | 420.1 | |
| MA50: | 405.8 | |
| MA100: | 411.5 | |
| MAexp7: | 424.4 | |
| MAexp20: | 418.5 | |
| MAexp50: | 411.5 | |
| MAexp100: | 410.8 | |
| Price / MA7: | -4.14% | |
| Price / MA20: | -2.45% | |
| Price / MA50: | +0.99% | |
| Price / MA100: | -0.41% | |
| Price / MAexp7: | -3.44% | |
| Price / MAexp20: | -2.08% | |
| Price / MAexp50: | -0.41% | |
| Price / MAexp100: | -0.24% |
News
Don"t forget to follow the news on PLAYTECH ORD NPV. At the time of publication of this analysis, the latest news was as follows:
- Continent 8 and Playtech Strengthen 20-year Partnership with New Global Agreement
-
 Playtech
-
Playtech
- Armin Sageder to Lead Playtech BGT Sports
-
Playtech
About author

Online


Add a comment
Comments
0 comments on the analysis PLAYTECH ORD NPV - Daily