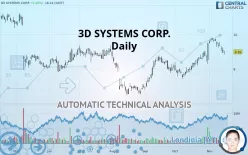
3D SYSTEMS CORP. - Daily - Technical analysis published on 11/15/2019 (GMT)
- 416
- 0
- Who voted?
Click here for a new analysis!
- Timeframe : Daily
- - Analysis generated on
- Status : LEVEL MAINTAINED

Summary of the analysis

Additional analysis
Quotes
The 3D SYSTEMS CORP. price is 8.99 USD. The price registered an increase of +0.45% on the session with the lowest point at 8.83 USD and the highest point at 9.05 USD. The deviation from the price is +1.81% for the low point and -0.66% for the high point.The Central Gaps scanner detects a bullish opening marking the presence of buyers ahead of sellers at the opening but not sufficiently marked to allow the price to register a quotation gap.
Bullish opening
Type : Bullish
Timeframe : Openning
So that you have an overall view of the price change, here is a table showing the variations over several periods:
Technical
Technical analysis of 3D SYSTEMS CORP. in Daily shows an overall bullish trend. 75% of the signals given by moving averages are bullish. Caution: the neutral signals currently given by the short-term moving averages indicate that this bullish trend is showing signs of running out of steam. The Central Indicators market scanner is currently detecting several bearish signals that could impact this trend:
Bearish trend reversal : adaptative moving average 20
Type : Bearish
Timeframe : Daily
Bearish price crossover with Moving Average 20
Type : Bearish
Timeframe : Daily
Bearish price crossover with adaptative moving average 50
Type : Bearish
Timeframe : Daily
On the 18 technical indicators analysed, 4 are bullish, 6 are neutral and 8 are bearish. Central Indicators, the scanner specialised in technical indicators, has identified these signals:
Pivot points : price is under support 3
Type : Neutral
Timeframe : Weekly
Price is back under the pivot point
Type : Bearish
Timeframe : Daily
Williams %R indicator is back under -50
Type : Bearish
Timeframe : Daily
No signals are given by Central Patterns, a market scanner specialised in chart patterns, resistances and supports.
The Central Candlesticks scanner which studies Japanese candlesticks did not detect anything.
| S2 | S1 | Price | R1 | R2 | R3 | |
|---|---|---|---|---|---|---|
| ProTrendLines | 6.55 | 7.86 | 8.99 | 9.21 | 11.16 | 12.52 |
| Change (%) | -27.14% | -12.57% | - | +2.45% | +24.14% | +39.27% |
| Change | -2.44 | -1.13 | - | +0.22 | +2.17 | +3.53 |
| Level | Intermediate | Intermediate | - | Major | Major | Minor |
To determine price objectives, it is also possible to use the pivot points. Here is the price position in relation to pivot points:
| Pivot points | S3 | S2 | S1 | PP | R1 | R2 | R3 |
|---|---|---|---|---|---|---|---|
| Standard | 8.51 | 8.72 | 8.83 | 9.04 | 9.15 | 9.36 | 9.47 |
| Camarilla | 8.86 | 8.89 | 8.92 | 8.95 | 8.98 | 9.01 | 9.04 |
| Woodie | 8.47 | 8.70 | 8.79 | 9.02 | 9.11 | 9.34 | 9.43 |
| Fibonacci | 8.72 | 8.84 | 8.91 | 9.04 | 9.16 | 9.23 | 9.36 |
| Pivot points | S3 | S2 | S1 | PP | R1 | R2 | R3 |
|---|---|---|---|---|---|---|---|
| Standard | 8.66 | 8.97 | 9.19 | 9.50 | 9.72 | 10.03 | 10.25 |
| Camarilla | 9.27 | 9.32 | 9.37 | 9.42 | 9.47 | 9.52 | 9.57 |
| Woodie | 8.63 | 8.95 | 9.16 | 9.48 | 9.69 | 10.01 | 10.22 |
| Fibonacci | 8.97 | 9.17 | 9.29 | 9.50 | 9.70 | 9.82 | 10.03 |
| Pivot points | S3 | S2 | S1 | PP | R1 | R2 | R3 |
|---|---|---|---|---|---|---|---|
| Standard | 5.99 | 6.71 | 8.10 | 8.82 | 10.21 | 10.93 | 12.32 |
| Camarilla | 8.91 | 9.10 | 9.30 | 9.49 | 9.68 | 9.88 | 10.07 |
| Woodie | 6.33 | 6.88 | 8.44 | 8.99 | 10.55 | 11.10 | 12.66 |
| Fibonacci | 6.71 | 7.52 | 8.01 | 8.82 | 9.63 | 10.12 | 10.93 |
Numerical data
The following are the details of the technical indicators and moving averages that were collected to generate this technical analysis:
| RSI (14): | 49.98 | |
| MACD (12,26,9): | 0.2400 | |
| Directional Movement: | -1.50 | |
| AROON (14): | 21.43 | |
| DEMA (21): | 9.41 | |
| Parabolic SAR (0,02-0,02-0,2): | 9.80 | |
| Elder Ray (13): | -0.23 | |
| Super Trend (3,10): | 8.77 | |
| Zig ZAG (10): | 8.94 | |
| VORTEX (21): | 1.1000 | |
| Stochastique (14,3,5): | 48.44 | |
| TEMA (21): | 9.43 | |
| Williams %R (14): | -55.67 | |
| Chande Momentum Oscillator (20): | 0.22 | |
| Repulse (5,40,3): | -2.2900 | |
| ROCnROLL: | -1 | |
| TRIX (15,9): | 0.5900 | |
| Courbe Coppock: | 13.05 |
| MA7: | 9.27 | |
| MA20: | 9.11 | |
| MA50: | 8.51 | |
| MA100: | 8.27 | |
| MAexp7: | 9.19 | |
| MAexp20: | 9.04 | |
| MAexp50: | 8.63 | |
| MAexp100: | 8.62 | |
| Price / MA7: | -3.02% | |
| Price / MA20: | -1.32% | |
| Price / MA50: | +5.64% | |
| Price / MA100: | +8.71% | |
| Price / MAexp7: | -2.18% | |
| Price / MAexp20: | -0.55% | |
| Price / MAexp50: | +4.17% | |
| Price / MAexp100: | +4.29% |
News
Don"t forget to follow the news on 3D SYSTEMS CORP.. At the time of publication of this analysis, the latest news was as follows:
- 3D Systems' Cimatron® CAD/CAM Software Boosts Productivity and Improves Efficiencies for Tool Makers
- 3D Systems Expands its Industry-Leading Portfolio of Dental Materials with Newly FDA-Cleared NextDent® Denture 3D+
- America Makes and Department of Defense Select 3D Systems to Help Reduce Part Corrosion - Potential to Significantly Reduce Maintenance Costs
- 3D Systems and Antleron Collaborating to Accelerate 3D Printing Biomedical Breakthroughs
- 3D Systems' Cimatron CAD/CAM Software Enables Mold Shops to Design and Manufacture More Complex Molds, Faster--Keeping them Ahead of the Competition
About author

Online


Add a comment
Comments
0 comments on the analysis 3D SYSTEMS CORP. - Daily