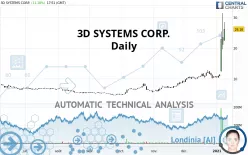
3D SYSTEMS CORP. - Daily - Technical analysis published on 01/11/2021 (GMT)
- 430
- 0
Click here for a new analysis!
- Timeframe : Daily
- - Analysis generated on
- Status : TARGET REACHED

Summary of the analysis

Additional analysis
Quotes
3D SYSTEMS CORP. rating 26.16 USD. The price has increased by +11.18% since the last closing with the lowest point at 22.39 USD and the highest point at 28.50 USD. The deviation from the price is +16.84% for the low point and -8.21% for the high point.The Central Gaps scanner detects a bearish opening marking the presence of sellers ahead of buyers at the opening but not sufficiently marked to allow the price to register a quotation gap.
Bearish opening
Type : Bearish
Timeframe : Openning
Here is a more detailed summary of the historical variations registered by 3D SYSTEMS CORP.:
Abnormal volumes
Timeframe : 5 days
Abnormal volumes
Timeframe : 20 days
Abnormal volumes
Timeframe : 50 days
Technical
Technical analysis of this Daily chart of 3D SYSTEMS CORP. indicates that the overall trend is strongly bullish. 92.86% of the signals given by moving averages are bullish. The overall trend is supported by the strong bullish signals from short-term moving averages. There is no crossing of moving average by the price or crossing of moving averages between themselves.
In fact, according to the parameters integrated into the Central Analyzer system, 16 technical indicators out of 18 analysed are currently bullish. But beware of excesses. The Central Indicators scanner currently detects this:
RSI indicator is overbought : over 80
Type : Neutral
Timeframe : Daily
CCI indicator is overbought : over 100
Type : Neutral
Timeframe : Daily
Previous candle closed over Bollinger bands
Type : Neutral
Timeframe : Daily
Williams %R indicator is overbought : over -20
Type : Neutral
Timeframe : Daily
Price is back over the pivot point
Type : Bullish
Timeframe : Weekly
An analysis of the price chart with the Central Patterns scanner (detector of chart patterns and resistances and supports) shows a result that can have an impact on the price change:
Near horizontal resistance
Type : Bearish
Timeframe : Daily
For a small rebound in the very short term, the Central Candlesticks scanner currently notes the presence of this bullish pattern in Japanese candlesticks:
Long white line
Type : Bullish
Timeframe : Daily
| S3 | S2 | S1 | Price | R1 | R2 | R3 | |
|---|---|---|---|---|---|---|---|
| ProTrendLines | 14.22 | 21.61 | 23.31 | 26.16 | 46.53 | 63.46 | 96.42 |
| Change (%) | -45.64% | -17.39% | -10.89% | - | +77.87% | +142.58% | +268.58% |
| Change | -11.94 | -4.55 | -2.85 | - | +20.37 | +37.30 | +70.26 |
| Level | Minor | Intermediate | Minor | - | Minor | Minor | Major |
Pivot points can also be used to set your price objectives. Here is the price situation in relation to pivot points:
| Pivot points | S3 | S2 | S1 | PP | R1 | R2 | R3 |
|---|---|---|---|---|---|---|---|
| Standard | 6.42 | 13.01 | 18.27 | 24.86 | 30.12 | 36.71 | 41.97 |
| Camarilla | 20.27 | 21.36 | 22.44 | 23.53 | 24.62 | 25.70 | 26.79 |
| Woodie | 5.76 | 12.68 | 17.61 | 24.53 | 29.46 | 36.38 | 41.31 |
| Fibonacci | 13.01 | 17.54 | 20.33 | 24.86 | 29.39 | 32.18 | 36.71 |
| Pivot points | S3 | S2 | S1 | PP | R1 | R2 | R3 |
|---|---|---|---|---|---|---|---|
| Standard | -9.11 | 0.58 | 12.06 | 21.75 | 33.23 | 42.92 | 54.40 |
| Camarilla | 17.71 | 19.65 | 21.59 | 23.53 | 25.47 | 27.41 | 29.35 |
| Woodie | -8.23 | 1.03 | 12.95 | 22.20 | 34.12 | 43.37 | 55.29 |
| Fibonacci | 0.58 | 8.67 | 13.67 | 21.75 | 29.84 | 34.84 | 42.92 |
| Pivot points | S3 | S2 | S1 | PP | R1 | R2 | R3 |
|---|---|---|---|---|---|---|---|
| Standard | 4.62 | 6.70 | 8.59 | 10.68 | 12.57 | 14.65 | 16.54 |
| Camarilla | 9.39 | 9.75 | 10.12 | 10.48 | 10.84 | 11.21 | 11.57 |
| Woodie | 4.52 | 6.65 | 8.49 | 10.63 | 12.47 | 14.60 | 16.44 |
| Fibonacci | 6.70 | 8.22 | 9.16 | 10.68 | 12.20 | 13.14 | 14.65 |
Numerical data
The following is the status of technical indicators and moving averages registered at the time this technical analysis was created:
| RSI (14): | 89.75 | |
| MACD (12,26,9): | 2.9700 | |
| Directional Movement: | 50.62 | |
| AROON (14): | 50.00 | |
| DEMA (21): | 17.47 | |
| Parabolic SAR (0,02-0,02-0,2): | 11.27 | |
| Elder Ray (13): | 9.74 | |
| Super Trend (3,10): | 16.46 | |
| Zig ZAG (10): | 25.04 | |
| VORTEX (21): | 1.2400 | |
| Stochastique (14,3,5): | 72.43 | |
| TEMA (21): | 19.19 | |
| Williams %R (14): | -29.68 | |
| Chande Momentum Oscillator (20): | 13.32 | |
| Repulse (5,40,3): | 27.2400 | |
| ROCnROLL: | 1 | |
| TRIX (15,9): | 2.0400 | |
| Courbe Coppock: | 110.75 |
| MA7: | 16.50 | |
| MA20: | 12.92 | |
| MA50: | 9.92 | |
| MA100: | 7.82 | |
| MAexp7: | 18.71 | |
| MAexp20: | 14.11 | |
| MAexp50: | 11.00 | |
| MAexp100: | 9.20 | |
| Price / MA7: | +58.55% | |
| Price / MA20: | +102.48% | |
| Price / MA50: | +163.71% | |
| Price / MA100: | +234.53% | |
| Price / MAexp7: | +39.82% | |
| Price / MAexp20: | +85.40% | |
| Price / MAexp50: | +137.82% | |
| Price / MAexp100: | +184.35% |
News
The latest news and videos published on 3D SYSTEMS CORP. at the time of the analysis were as follows:
-
 3D Systems Corporation - DDD Stock Chart Technical Analysis for 01-08-2021
-
3D Systems Corporation - DDD Stock Chart Technical Analysis for 01-07-2021
- Thinking about buying stock in 3D Systems, Nio, Orchard Therapeutics, Check Cap, or Gevo?
- Thinking about buying stock in O2Micro International, Sasol Limited, 3D Systems, Cronos Group, or Sorrento Therapeutics?
- Thinking about buying stock in Gilead Sciences, Cassava Sciences, BEST Inc, 3D Systems, or Mattel?
About author

Online


Add a comment
Comments
0 comments on the analysis 3D SYSTEMS CORP. - Daily