
- Status :
- Language : English
- Registered on :
- Analyses : 14
- Overall rating : 39
- Comments : 11
- Followers : 3
- Followed : 3
Technical analyses from TTTTrading
Sort : Latest comments | Latest posted
BITCOIN - BTC/USD
> Analyses

 Thank you
Reply
Chart
Thank you
Reply
Chart
TTTTrading has published a new analysis.
- 3
- 14
- 39
- 11
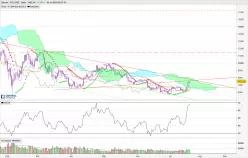
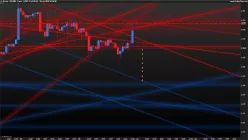
Timeframe : Daily - Simple chart
If you want to go long, wait till this 8 month downtrend has broken here, Until then you are buying right at the very top
BITCOIN - BTC/USD
> Analyses
 Thank you
Reply
Chart
Thank you
Reply
Chart
TTTTrading has published a new analysis.
- 3
- 14
- 39
- 11
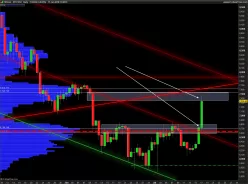
Timeframe : Daily - Simple chart
It is an 800 BTC wall to break the daily order block in 30 mins, It is not looking possible, BTC is looking weak and slow. If we don't break the order block before the daily close in 30mins, we pull…
BITCOIN - BTC/USD
> Analyses
 Thank you
Reply
Chart
Thank you
Reply
Chart
TTTTrading has published a new analysis.
- 3
- 14
- 39
- 11
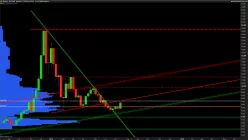
Timeframe : Weekly - Simple chart
This channel upwards trends from July - August 2017, the white lines I added to show your price action. the pull back to daily bearish block 6720 will most likely happen if we do not break this…
BITCOIN - BTC/USD
> Analyses
 Thank you
Reply
Chart
Thank you
Reply
Chart
TTTTrading has published a new analysis.
- 3
- 14
- 39
- 11
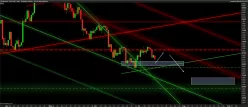
Timeframe : Daily - Simple chart
Todays daily red and a bounce to 6500 then a possible 7200 before then a short till that will end at the start of the 2nd week into August. BTC Bottom will be below 5400
I did originally say…
BITCOIN - BTC/USD
> Analyses
 Thank you
Reply
Chart
Thank you
Reply
Chart
TTTTrading has published a new analysis.
- 3
- 14
- 39
- 11
Timeframe : 30 min. - Simple chart
Even though so much is bullish on lower time frames under 30 mins, I remain un-changed and stand by my belief and statements based on my knowledge and what I have learnt.
BITCOIN - BTC/USD
> Analyses
 Thank you
Reply
Chart
Thank you
Reply
Chart
TTTTrading has published a new analysis.
- 3
- 14
- 39
- 11
Timeframe : 1H - Simple chart
Updated on the previous TA and position after price closed off the rejection just outside of the triangle. I am remaining in my short till I see some higher high's, and increased volume before I close…
BITCOIN - BTC/USD
> Analyses
 Thank you
Reply
Chart
Thank you
Reply
Chart
TTTTrading has published a new analysis.
- 3
- 14
- 39
- 11
Timeframe : 1H - Chart + Trading signal
Rejected at the weekly resistance, 6300 Here we come, "should" break down from the descending triangle
BITCOIN - BTC/USD
> Analyses
Thank you
Reply
Chart

BITCOIN - BTC/USD
> Analyses
 Thank you
Reply
Chart
Thank you
Reply
Chart
TTTTrading has published a new analysis.
- 3
- 14
- 39
- 11
Timeframe : Daily - Simple chart
This Is The End Of The Bitcoin Long Term Downtrend. Sub $5300 By June 30th and I can not see it possibly going lower then $4100. Bull
Should see the Bull Run well on its way by the 4th of July, and a…

