EUR/USD
> Analyses

 Thank you
Reply
Chart
Thank you
Reply
Chart
Vincent Launay has published a new analysis.
- 1876
- 12803
- 41138
- 17259
Timeframe : 1H - Chart + One way trading
CAC40 FCE FULL0425
> Analyses
 Thank you
Reply
Chart
Thank you
Reply
Chart
Vincent Launay has published a new analysis.
- 1876
- 12803
- 41138
- 17259
Timeframe : 1H - Chart + One way trading
BITCOIN - BTC/USD
> Analyses
 Thank you
Reply
Chart
Thank you
Reply
Chart
Vincent Launay has published a new analysis.
- 1876
- 12803
- 41138
- 17259
Timeframe : 15 min. - Chart + One way trading
EUR/CAD
> Analyses
 Thank you
Reply
Chart
Thank you
Reply
Chart
Vincent Launay has published a new analysis.
- 1876
- 12803
- 41138
- 17259
Timeframe : 4H - Chart + One way trading
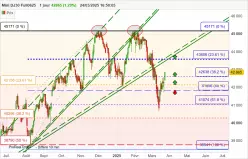
DOW JONES - MINI DJ30 FULL0625
> Analyses
 Thank you
Reply
Chart
Thank you
Reply
Chart
Vincent Launay has published a new analysis.
- 1876
- 12803
- 41138
- 17259
Timeframe : Daily - Chart + One way trading
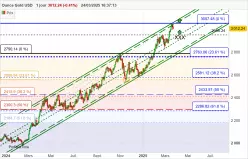
GOLD - USD
> Analyses
 Thank you
Reply
Chart
Thank you
Reply
Chart
Vincent Launay has published a new analysis.
- 1876
- 12803
- 41138
- 17259
Timeframe : Daily - Chart + One way trading
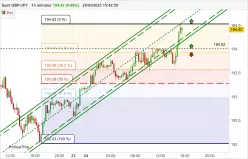
GBP/JPY
> Analyses
 Thank you
Reply
Chart
Thank you
Reply
Chart
Vincent Launay has published a new analysis.
- 1876
- 12803
- 41138
- 17259
Timeframe : 15 min. - Chart + One way trading
SOLANA - SOL/USD
> Analyses
 Thank you
Reply
Chart
Thank you
Reply
Chart
Vincent Launay has published a new analysis.
- 1876
- 12803
- 41138
- 17259
Timeframe : 4H - Chart + One way trading
WTI CRUDE OIL
> Analyses
 Thank you
Reply
Chart
Thank you
Reply
Chart
Vincent Launay has published a new analysis.
- 1876
- 12803
- 41138
- 17259
Timeframe : 8H - Chart + One way trading
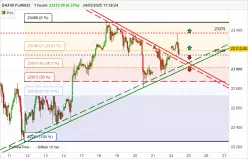
DAX40 FULL0625
> Analyses
 Thank you
Reply
Chart
Thank you
Reply
Chart
Vincent Launay has published a new analysis.
- 1876
- 12803
- 41138
- 17259
Timeframe : 1H - Chart + One way trading

