Technical analyses - MANHATTAN ASSOCIATES INC. - English
You are currently viewing all technical analyses of the financial instrument MANHATTAN ASSOCIATES INC. regarding all markets in English regarding all markets, sorted by Latest comments.
Sort : Latest comments | Latest posted
MANHATTAN ASSOCIATES INC.
> Analyses

 Thank you
Reply
Chart
Thank you
Reply
Chart
Londinia
has published a new analysis.
- 0
- 96797
- 15900
- 0
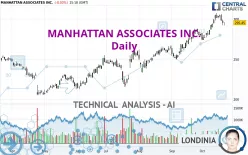
Timeframe : Daily - Simple chart
Status : INVALID
MANHATTAN ASSOCIATES INC. is part of a very strong bullish trend. Traders may consider trading only long positions (at the time of purchase) as long as the price remains well above 286.00 USD. The…
MANHATTAN ASSOCIATES INC.
> Analyses
 Thank you
Reply
Chart
Thank you
Reply
Chart
Londinia
has published a new analysis for Vincent Launay.
- 0
- 96797
- 15900
- 0
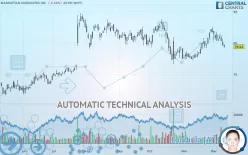
Timeframe : Daily - Simple chart
Status : NEUTRAL
The basic trend is neutral and the short term is tentatively bearish. With such a pattern, it is difficult to favour buying or selling. The first support is located at 76.96 USD. The first resistance…
MANHATTAN ASSOCIATES INC.
> Analyses
 Thank you
Reply
Chart
Thank you
Reply
Chart
Londinia
has published a new analysis for Vincent Launay.
- 0
- 96797
- 15900
- 0
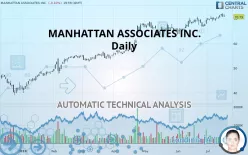
Timeframe : Daily - Simple chart
Status : TARGET REACHED
The bullish trend is currently very strong on MANHATTAN ASSOCIATES INC.. As long as the price remains above the support at 68.70 USD, you could try to benefit from the boom. The first bullish…

