Technical analyses - RADIX - XRD/USD - English
You are currently viewing all technical analyses of the financial instrument RADIX - XRD/USD regarding all markets in English regarding all markets, sorted by Latest comments.
Sort : Latest comments | Latest posted
- 0
- 97688
- 15983
- 0

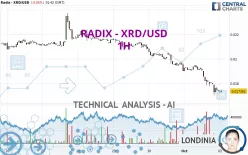
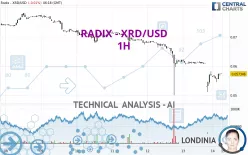
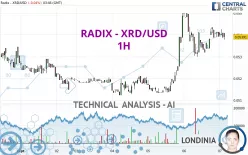
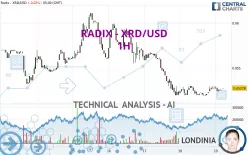
Timeframe : 1H - Simple chart
Status : LEVEL MAINTAINED
- 0
- 97688
- 15983
- 0

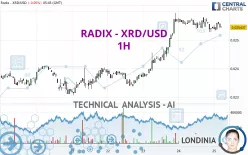
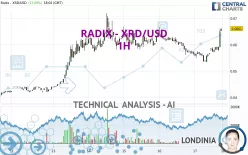
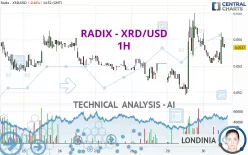
Timeframe : 1H - Simple chart
Status : NEUTRAL
- 0
- 97688
- 15983
- 0
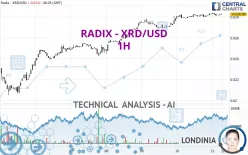
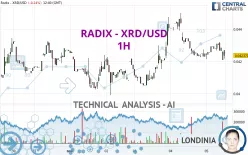
Timeframe : 1H - Simple chart
Status : LEVEL MAINTAINED
- 0
- 97688
- 15983
- 0
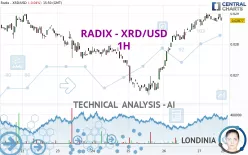
Timeframe : 1H - Simple chart
Status : INVALID
- 0
- 97688
- 15983
- 0
Timeframe : 1H - Simple chart
Status : INVALID
- 0
- 97688
- 15983
- 0
Timeframe : 1H - Simple chart
Status : INVALID
- 0
- 97688
- 15983
- 0
Timeframe : 1H - Simple chart
Status : LEVEL MAINTAINED
- 0
- 97688
- 15983
- 0
Timeframe : 1H - Simple chart
Status : TARGET REACHED
- 0
- 97688
- 15983
- 0
Timeframe : 1H - Simple chart
Status : NEUTRAL
- 0
- 97688
- 15983
- 0
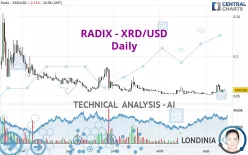
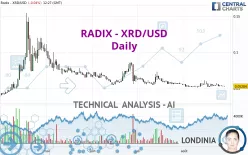
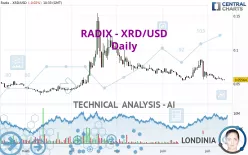
Timeframe : Daily - Simple chart
Status : TARGET REACHED
- 0
- 97688
- 15983
- 0
Timeframe : 1H - Simple chart
Status : INVALID
- 0
- 97688
- 15983
- 0
Timeframe : 1H - Simple chart
Status : LEVEL MAINTAINED
- 0
- 97688
- 15983
- 0
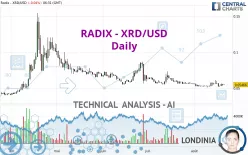
Timeframe : Daily - Simple chart
Status : INVALID
- 0
- 97688
- 15983
- 0
Timeframe : Daily - Simple chart
Status : INVALID
- 0
- 97688
- 15983
- 0
Timeframe : 1H - Simple chart
Status : INVALID
- 0
- 97688
- 15983
- 0

Timeframe : Daily - Simple chart
Status : LEVEL MAINTAINED
- 0
- 97688
- 15983
- 0

Timeframe : Daily - Simple chart
Status : LEVEL MAINTAINED
- 0
- 97688
- 15983
- 0
Timeframe : Daily - Simple chart
Status : INVALID
- 0
- 97688
- 15983
- 0

Timeframe : 1H - Simple chart
Status : TARGET REACHED
- 0
- 97688
- 15983
- 0

Timeframe : Daily - Simple chart
Status : NEUTRAL

