Technical analyses - ELECTRONIC ARTS INC. - English
You are currently viewing all technical analyses of the financial instrument ELECTRONIC ARTS INC. regarding all markets in English regarding all markets, sorted by Latest comments.
Sort : Latest comments | Latest posted
ELECTRONIC ARTS INC.
> Analyses

 Thank you
Reply
Chart
Thank you
Reply
Chart
Exness has published a new analysis.
- 17
- 343
- 52
- 0
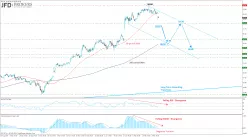
Timeframe : Daily - Simple chart
Shares in Electronic Arts, Inc. (symbol ‘EA’) managed to recuperate its losses , which shot up to 13% in the first quarter, and is currently sitting on a small profit percentage of around 1%. The…
ELECTRONIC ARTS INC.
> Analyses

 Thank you
Reply
Chart
Thank you
Reply
Chart
Londinia
has published a new analysis for Traderbradg.
- 0
- 94310
- 15813
- 0
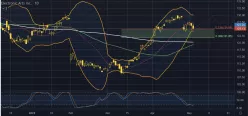
Timeframe : 1H - Simple chart
Status : TARGET REACHED
ELECTRONIC ARTS INC. is part of a very strong bearish trend. Traders may consider trading only short positions (for sale) as long as the price remains well below 119.42 USD. The next support located…
ELECTRONIC ARTS INC.
> Analyses
 Thank you
Reply
Chart
Thank you
Reply
Chart
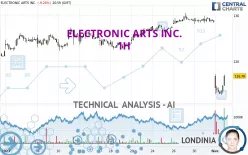
Timeframe : Daily - Simple chart
Status : INVALID
We are currently in a phase of short-term indecision. In a case like this, you could favour trades in the direction of the basic trend on ELECTRONIC ARTS INC.. As long as you are above the support…
ELECTRONIC ARTS INC.
> Analyses
 Thank you
Reply
Chart
Thank you
Reply
Chart
Londinia
has published a new analysis for Vincent Launay.
- 0
- 94310
- 15813
- 0
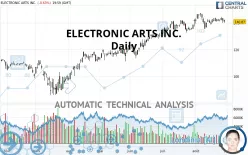
Timeframe : Daily - Simple chart
Status : LEVEL MAINTAINED
The basic bullish trend is very strong on ELECTRONIC ARTS INC. but the short term shows some signs of running out of steam. However, a purchase could be considered as long as the price remains above…
ELECTRONIC ARTS INC.
> Analyses
Thank you
Reply
Chart