Technical analyses - UBS GROUP N - English
You are currently viewing all technical analyses of the financial instrument UBS GROUP N regarding all markets in English regarding all markets, sorted by Latest comments.
Sort : Latest comments | Latest posted
UBS GROUP N
> Analyses

 Thank you
Reply
Chart
Thank you
Reply
Chart
Londinia
has published a new analysis.
- 0
- 92793
- 15748
- 0
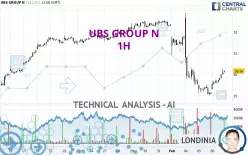
Timeframe : 1H - Simple chart
Status : INVALID
Has the basic bearish trend slowed or is it lacking in power? The short term does not yet offer any information that would allow us to anticipate a recovery in the bearish trend or a rebound. Sellers'…
UBS GROUP N
> Analyses
 Thank you
Reply
Chart
Thank you
Reply
Chart
Londinia
has published a new analysis.
- 0
- 92793
- 15748
- 0
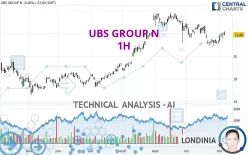
Timeframe : 1H - Simple chart
Status : INVALID
UBS GROUP N is part of a very strong bullish trend. Traders may consider trading only long positions (at the time of purchase) as long as the price remains well above 22.2100 CHF. The next resistance…
UBS GROUP N
> Analyses
 Thank you
Reply
Chart
Thank you
Reply
Chart
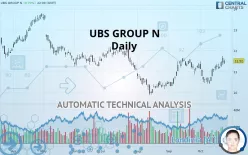
Timeframe : Daily - Simple chart
Status : INVALID
UBS GROUP N is part of a very strong bearish trend. Traders may consider trading only short positions (for sale) as long as the price remains well below 18.3525 CHF. The next support located at…
UBS GROUP N
> Analyses
 Thank you
Reply
Chart
Thank you
Reply
Chart
Londinia
has published a new analysis for Vincent Launay.
- 0
- 92793
- 15748
- 0
Timeframe : Daily - Simple chart
Status : TARGET REACHED
In the short term, there could be an acceleration of the basic bullish trend on UBS GROUP N. This is a positive signal for buyers. As long as the price remains above 11.29 CHF, a purchase could be…

