
- Status :
- Language : English
- Registered on :
- Analyses : 62
- Overall rating : 40
- Comments : 0
- Followers : 11
- Followed : 0
Technical analyses from SBernukhov_Exness
Sort : Latest comments | Latest posted
EUR/USD
> Analyses

 Thank you
Reply
Chart
Thank you
Reply
Chart
SBernukhov_Exness has published a new analysis.
- 11
- 62
- 40
- 0
Timeframe : Daily - Simple chart
EURUSD had bounced off to the 200-day moving average, having trimmed its recent gains amid a local growth of yields of 30-year bonds of the US. The pressure looks quite strong, but the 200-day moving…
WTI CRUDE OIL
> Analyses
 Thank you
Reply
Chart
Thank you
Reply
Chart
SBernukhov_Exness has published a new analysis.
- 11
- 62
- 40
- 0
Timeframe : 30 min. - Simple chart
Crude oil had reached the psychological level of $70, and that might become a potential crash test for the rally: should the level be rejected, it may trigger a liquidation of the upside move, as this…
WTI CRUDE OIL
> Analyses
 Thank you
Reply
Chart
Thank you
Reply
Chart
SBernukhov_Exness has published a new analysis.
- 11
- 62
- 40
- 0
Timeframe : Daily - Simple chart
Crude oil is under pressure as political narratives drive it lower. The $70 area is a fair price according to the supply/demand estimate from the Energy Administration of the United States.
The…
GOLD - USD
> Analyses
 Thank you
Reply
Chart
Thank you
Reply
Chart
SBernukhov_Exness has published a new analysis.
- 11
- 62
- 40
- 0
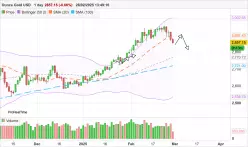
Timeframe : Daily - Simple chart
Gold had plummeted for the 3rd day in a row, sliding from the peak of the range, as the upswing for Gold was already mature and developing for more than 46 days without any meaningful correction. So,…
BAIDU INC. ADS
> Analyses
 Thank you
Reply
Chart
Thank you
Reply
Chart
SBernukhov_Exness has published a new analysis.
- 11
- 62
- 40
- 0
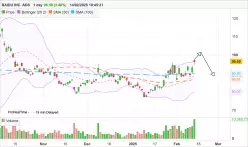
Timeframe : Daily - Simple chart
Despite the strong driving narrative, BIDU had displayed less prominent growth than BABA, and had reached the upper border of Bollinger bands indicator with a parameter of 50. This usually might…
ALIBABA GROUP HOLDING
> Analyses
 Thank you
Reply
Chart
Thank you
Reply
Chart
SBernukhov_Exness has published a new analysis.
- 11
- 62
- 40
- 0
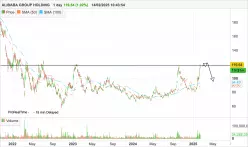
Timeframe : Daily - Simple chart
Alibaba stock price was moving in a sharp rally within the last two weeks period, having reached the psychological level of $117 and a strong resistance area. If this level holds, it’s possible to…
ETHEREUM - ETH/USD
> Analyses
 Thank you
Reply
Chart
Thank you
Reply
Chart
SBernukhov_Exness has published a new analysis.
- 11
- 62
- 40
- 0
Timeframe : 30 min. - Simple chart
ETHUSD Short Setup – Bearish Breakout Potential📉 Technical Setup:Ethereum is forming a narrowing structure, and a downside breakout of the trendline could trigger an acceleration towards $2400…
SILVER - USD
> Analyses
 Thank you
Reply
Chart
Thank you
Reply
Chart
SBernukhov_Exness has published a new analysis.
- 11
- 62
- 40
- 0
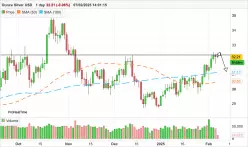
Timeframe : Daily - Simple chart
Silver produces similar dynamics, as Gold (as silver has a proven statistical correlation with gold), but it might contain hidden weakness. The price crossing the static resistance level of $32 puts…
CAD/JPY
> Analyses
 Thank you
Reply
Chart
Thank you
Reply
Chart
SBernukhov_Exness has published a new analysis.
- 11
- 62
- 40
- 0
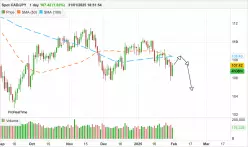
Timeframe : Daily - Simple chart
The Canadian dollar is losing ground to Japanese Yen, as differences between monetary policy expectations between respective currencies start to deviate. A steady performance of yields of 30-year…

