NIO INC. ADS
> Analyses

 Thank you
Reply
Chart
Thank you
Reply
Chart
Exness has published a new analysis.
- 17
- 343
- 52
- 0
Timeframe : Daily - Simple chart
NIO Limited's (symbol ‘NIO’) share price managed to cover the downward move through the quarter and closed at almost 0% change. The company’s earnings report for the fiscal quarter ending…
GOLD - USD
> Analyses
 Thank you
Reply
Chart
Thank you
Reply
Chart
Exness has published a new analysis.
- 17
- 343
- 52
- 0
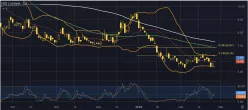
Timeframe : Daily - Simple chart
Gold prices remained within a tight trading range between $2,025 - $2,035 amid concerns of higher-for-longer U.S. rates, driven by signs of sticky U.S. inflation and resilience in the job market which…

ALPHABET INC. CLASS C
> Analyses
 Thank you
Reply
Chart
Thank you
Reply
Chart
Exness has published a new analysis.
- 17
- 343
- 52
- 0
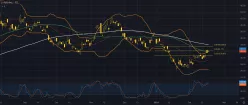
Timeframe : Daily - Simple chart
GOOG is positioning at a local dynamic support area of $144 after a pullback fueled by issues with Gemini AI. It indicates an intermediate-term balance, but given a strong AI narrative and bullish…
NVIDIA CORP.
> Analyses
 Thank you
Reply
Chart
Thank you
Reply
Chart
Exness has published a new analysis.
- 17
- 343
- 52
- 0
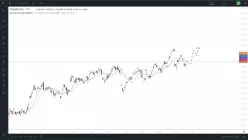
Timeframe : Daily - Simple chart
After the latest earnings call, there have been some concerns about NVDA maintaining the momentum for sales and growth, but investors still look forward to $5 per share EPS-wise in 2024.
After a…
EUR/USD
> Analyses
 Thank you
Reply
Chart
Thank you
Reply
Chart
Exness has published a new analysis.
- 17
- 343
- 52
- 0
Timeframe : Daily - Simple chart
Now that both the Fed and the ECB are expected by small majorities to start cutting in June, the playing field for euro-dollar is a bit more level. Although economic conditions in the eurozone are on…
GOLD - USD
> Analyses
 Thank you
Reply
Chart
Thank you
Reply
Chart
Exness has published a new analysis.
- 17
- 343
- 52
- 0
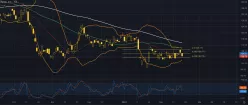
Timeframe : Daily - Simple chart
Gold has recovered steadily since the significant drop around inflation on 13 February. Now that the price is within the value area between the 50 and 100 SMAs, it might consolidate for a while before…
BAIDU INC. ADS
> Analyses
 Thank you
Reply
Chart
Thank you
Reply
Chart
Exness has published a new analysis.
- 17
- 343
- 52
- 0
Timeframe : Daily - Simple chart
Shares of Baidu, Inc. (symbol ‘BIDU’) incurred losses in the last quarter of the year and declined by around 12%. The company’s earnings report for the fiscal quarter ending December 2023 is…
LI AUTO INC. ADS
> Analyses
 Thank you
Reply
Chart
Thank you
Reply
Chart
Exness has published a new analysis.
- 17
- 343
- 52
- 0
Timeframe : Daily - Simple chart
Li Auto Inc. (symbol ‘LI’) share price had a pretty volatile quarter with gaps forming regularly on its chart but eventually managed to close the year on a positive sign of 3% for Q4. The…


