JACQUES BOGART
> Analyses

 Thank you
Reply
Chart
Thank you
Reply
Chart
Londinia
has published a new analysis.
- 0
- 94082
- 15809
- 0
Timeframe : Daily - Simple chart
Status : IN PROGRESS...
JACQUES BOGART is part of a very strong bearish trend. Traders may consider trading only short positions (for sale) as long as the price remains well below . The next support located at is the…
RANDSTAD NV
> Analyses
Thank you
Reply
Chart

RANDSTAD NV
> Analyses
 Thank you
Reply
Chart
Thank you
Reply
Chart
Londinia
has published a new analysis.
- 0
- 94082
- 15809
- 0
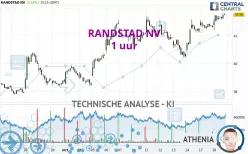
Timeframe : 1H - Simple chart
Status : NEUTRAL
The basic trend is slightly bearish and the short term is tentatively bullish. With such a pattern, it is difficult to favour buying or selling. The first resistance is located at 35.62 EUR. The…
RANDSTAD NV
> Analyses
 Thank you
Reply
Chart
Thank you
Reply
Chart
Londinia
has published a new analysis.
- 0
- 94082
- 15809
- 0
Timeframe : Daily - Simple chart
Status : IN PROGRESS...
RANDSTAD NV is part of a very strong bearish trend. Traders may consider trading only short positions (for sale) as long as the price remains well below . The next support located at is the next…
RANDSTAD NV
> Analyses

 Thank you
Reply
Chart
Thank you
Reply
Chart
Athenia
has published a new analysis.
- 0
- 34078
- 8729
- 0
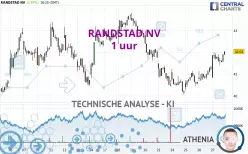
Timeframe : 1H - Simple chart
Status : TARGET REACHED
RANDSTAD NV
> Analyses
Thank you
Reply
Chart
RANDSTAD NV
> Analyses
 Thank you
Reply
Chart
Thank you
Reply
Chart
Athenia
has published a new analysis.
- 0
- 34078
- 8729
- 0
Timeframe : Daily - Simple chart
Status : NEUTRAL
RANDSTAD NV
> Analyses
 Thank you
Reply
Chart
Thank you
Reply
Chart
Athenia
has published a new analysis.
- 0
- 34078
- 8729
- 0
Timeframe : 1H - Simple chart
Status : LEVEL MAINTAINED
RANDSTAD NV
> Analyses
 Thank you
Reply
Chart
Thank you
Reply
Chart
Athenia
has published a new analysis.
- 0
- 34078
- 8729
- 0
Timeframe : Daily - Simple chart
Status : INVALID
RANDSTAD NV
> Analyses
Thank you
Reply
Chart