
- Status :
- Language : English
- Registered on :
- Analyses : 13
- Overall rating : 16
- Comments : 0
- Followers : 1
- Followed : 0
Technical analyses from Naeem Aslam - Page 2
Sort : Latest comments | Latest posted
GBP/USD
> Analyses
 Thank you
Reply
Chart
Thank you
Reply
Chart
Naeem Aslam has published a new analysis.
- 1
- 13
- 16
- 0
Timeframe : 30 min. - Simple chart
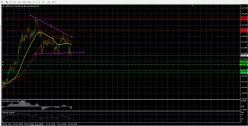
The GBP/USD pair is trading above its upward trend line on a 4 hour time frame. This confirms that the bias still stays towards the upside. The price is trading below the 50 day shown in yellow and…
USD/JPY
> Analyses
 Thank you
Reply
Chart
Thank you
Reply
Chart
Naeem Aslam has published a new analysis.
- 1
- 13
- 16
- 0
Timeframe : 30 min. - Simple chart
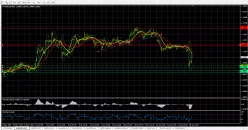
The USD/JPY is trading below its downward trend line on a 4 hour time frame. The price has broken its its downward wedge pattern and the projection of this pattern could the price well below the major…
EUR/USD
> Analyses
 Thank you
Reply
Chart
Thank you
Reply
Chart
Naeem Aslam has published a new analysis.
- 1
- 13
- 16
- 0
Timeframe : 30 min. - Simple chart
The EUR/USD pair is under tremendous pressure on a minute time frame. The price has pierced the Bollinger band at an important level of support zone which is mentioned below. The piercing of the…
GBP/USD
> Analyses
 Thank you
Reply
Chart
Thank you
Reply
Chart
Naeem Aslam has published a new analysis.
- 1
- 13
- 16
- 0
Timeframe : 4H - Simple chart
GBP/USD- UPWARD MOMENTUM PICKING UP
The GBP/USD pair is challenging its downward trend line on a 4 hour time frame and this represents that the lost upward momentum could be picking up. The trend…

