Analyses of Traders and financial instruments followed by Melina Deltas - Page 2
Sort : Latest comments | Latest posted
GBP/USD
> Analyses

 Thank you
Reply
Chart
Thank you
Reply
Chart
Barbara Nicodemou has published a new analysis.
- 25
- 127
- 302
- 4
Timeframe : 4H - Simple chart
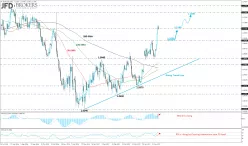
The GBP/USD gained momentum from the strong U.K. retail sales during the European session, exited the sideways channel with upper boundary 1.2990 and lower boundary 1.2830, and topped at 1.3048,…
EUR/USD
> Analyses
 Thank you
Reply
Chart
Thank you
Reply
Chart
Barbara Nicodemou has published a new analysis.
- 25
- 127
- 302
- 4
Timeframe : Daily - Simple chart
The EUR/USD had aggressive rises the last days, trading near its six-month highs levels, driven higher by the strong Eurozone's macroeconomic data and the weakness of greenback which is coming from…
USD/JPY
> Analyses
 Thank you
Reply
Chart
Thank you
Reply
Chart
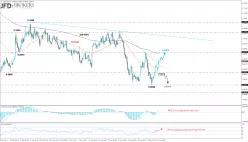
Barbara Nicodemou has published a new analysis.
- 25
- 127
- 302
- 4
Timeframe : Daily - Simple chart
The U.S. dollar edged sharply lower against the Japanese yen, losing more than 2% in a single day, on Wednesday after Trump’s scandal that caused political and economic uncertainty. USD/JPY slipped…
GBP/USD
> Analyses
 Thank you
Reply
Chart
Thank you
Reply
Chart
Barbara Nicodemou has published a new analysis.
- 25
- 127
- 302
- 4
Timeframe : 4H - Simple chart
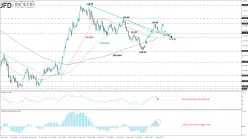
Sterling is still trading sideways versus the U.S. dollar over the last three weeks within the consolidation area with upper boundary the 1.2990 resistance level and lower boundary the 1.2830 support…
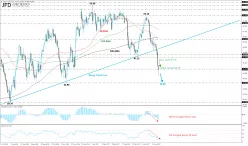
USD/JPY
> Analyses
 Thank you
Reply
Chart
Thank you
Reply
Chart
Barbara Nicodemou has published a new analysis.
- 25
- 127
- 302
- 4
Timeframe : Daily - Simple chart
The greenback is losing serious ground versus the Japanese yen as it is moving lower since yesterday's trading session. The USD/JPY pair plunged more than 1% and is ready to hit again the 112.20…
BRENT CRUDE OIL
> Analyses
Thank you
Reply
Chart
USD/JPY
> Analyses
 Thank you
Reply
Chart
Thank you
Reply
Chart
Barbara Nicodemou has published a new analysis.
- 25
- 127
- 302
- 4
Timeframe : Daily - Simple chart
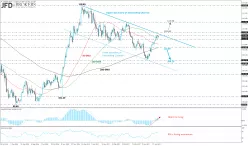
Over the last days, USD/JPY is trying without success to surpass the resistance level at 112.90, near the falling trendline, despite the better than expected U.S. employment report. The 50-SMA shows…
EUR/USD
> Analyses
 Thank you
Reply
Chart
Thank you
Reply
Chart
Barbara Nicodemou has published a new analysis.
- 25
- 127
- 302
- 4
Timeframe : Daily - Simple chart
The EUR/USD has been on a rollercoaster after the French elections result in favour of Emmanuel Macron. Initially, the euro favoured from the announcement and reached a six-month high, however,…
NZD/USD
> Analyses
 Thank you
Reply
Chart
Thank you
Reply
Chart
Barbara Nicodemou has published a new analysis.
- 25
- 127
- 302
- 4
Timeframe : 4H - Simple chart
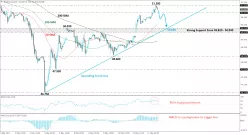
New Zealand dollar is rising against the U.S. dollar after the price rebounded on 0.6890 support zone and rose above the diagonal line, connecting the high from April 23 and May 03. Price is…
WTI CRUDE OIL
> Analyses
 Thank you
Reply
Chart
Thank you
Reply
Chart
Barbara Nicodemou has published a new analysis.
- 25
- 127
- 302
- 4
Timeframe : Daily - Simple chart
WTI crude oil dived even deeper and reached a 6-month low as investors doubt the ability of OPEC production cut scheme to limit production and boost prices. The black gold reached $44.00 a barrel in…

