Analyses of Traders and financial instruments followed by GL - Page 3
Sort : Latest comments | Latest posted
VEOM GROUP
> Analyses

 Thank you
Reply
Chart
Thank you
Reply
Chart
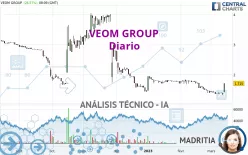
Madritia
has published a new analysis.
- 0
- 61626
- 9441
- 0
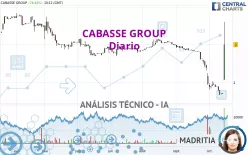
Timeframe : Daily - Simple chart
Status : NEUTRAL
VEOM GROUP
> Analyses

 Thank you
Reply
Chart
Thank you
Reply
Chart
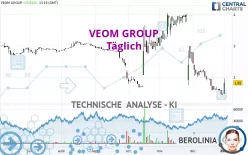
Berolinia
has published a new analysis.
- 0
- 67431
- 9589
- 0
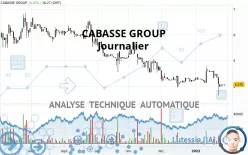
Timeframe : Daily - Simple chart
Status : INVALID
VEOM GROUP
> Analyses
 Thank you
Reply
Chart
Thank you
Reply
Chart
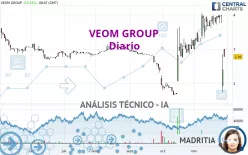
Madritia
has published a new analysis.
- 0
- 61626
- 9441
- 0
Timeframe : Daily - Simple chart
Status : TARGET REACHED
VEOM GROUP
> Analyses

 Thank you
Reply
Chart
Thank you
Reply
Chart
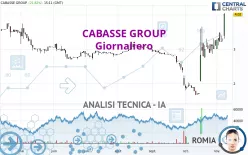
Romia
has published a new analysis.
- 0
- 46887
- 9287
- 0
Timeframe : Daily - Simple chart
Status : INVALID
VEOM GROUP
> Analyses
 Thank you
Reply
Chart
Thank you
Reply
Chart
Madritia
has published a new analysis.
- 0
- 61626
- 9441
- 0
Timeframe : Daily - Simple chart
Status : TARGET REACHED
VEOM GROUP
> Analyses
Thank you
Reply
Chart
DBV TECHNOLOGIES S.A. ADS
> Analyses
 Thank you
Reply
Chart
Thank you
Reply
Chart
Timeframe : Weekly - Simple chart
Status : INVALID
DBV TECHNOLOGIES S.A. ADS is part of a very strong bearish trend. Traders may consider trading only short positions (for sale) as long as the price remains well below 1.40 USD. The next support…
DBV TECHNOLOGIES S.A. ADS
> Analyses
 Thank you
Reply
Chart
Thank you
Reply
Chart
Timeframe : Daily - Simple chart
Status : INVALID
All elements being clearly bearish, it would be possible for traders to trade only short positions (for sale) on DBV TECHNOLOGIES S.A. ADS as long as the price remains well below 1.40 USD. The…
DBV TECHNOLOGIES S.A. ADS
> Analyses
 Thank you
Reply
Chart
Thank you
Reply
Chart
Timeframe : 1H - Simple chart
Status : INVALID
The bearish trend is currently very strong for DBV TECHNOLOGIES S.A. ADS. As long as the price remains below the resistance at 1.31 USD, you could try to take advantage of the bearish rally. The first…
VEOM GROUP
> Analyses
 Thank you
Reply
Chart
Thank you
Reply
Chart
Timeframe : Daily - Simple chart
Status : TARGET REACHED

