Analyses of Traders and financial instruments followed by Efthi Greg - Page 3
Sort : Latest comments | Latest posted
GBP/USD
> Analyses

 Thank you
Reply
Chart
Thank you
Reply
Chart
Melina Deltas has published a new analysis.
- 98
- 836
- 1878
- 0
Timeframe : Daily - Simple chart
Sterling is moving higher against the greenback over the last session as it recorded the third consecutive green day. The GBP/USD pair rose more than 0.5% on Wednesday and challenged once again the…
EUR/NOK
> Analyses
 Thank you
Reply
Chart
Thank you
Reply
Chart
Melina Deltas has published a new analysis.
- 98
- 836
- 1878
- 0
Timeframe : Daily - Simple chart
The EUR/NOK pair edged sharply lower over yesterday’s period following the strong rebound on the almost three-year high at 9.80 that it reached in the previous week. It worth to mention that the…
AUD/USD
> Analyses
 Thank you
Reply
Chart
Thank you
Reply
Chart
Melina Deltas has published a new analysis.
- 98
- 836
- 1878
- 0
Timeframe : Daily - Simple chart
The AUD/USD pair is moving lower over the last two months after the bounce off the 0.8125 resistance level. On Tuesday, the commodity currency pair created a bullish day following the touch on the…
USD/JPY
> Analyses
 Thank you
Reply
Chart
Thank you
Reply
Chart
Melina Deltas has published a new analysis.
- 98
- 836
- 1878
- 0
Timeframe : Weekly - Simple chart
Over the last eight months, the USD/JPY pair has established and traded within a consolidation area with upper boundary the 114.40 resistance level and lower boundary the 108.10 support level.…
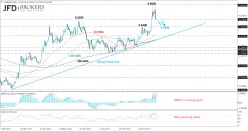
GBP/USD
> Analyses
 Thank you
Reply
Chart
Thank you
Reply
Chart
Melina Deltas has published a new analysis.
- 98
- 836
- 1878
- 0
Timeframe : Weekly - Simple chart
The cable is developing within an ascending tendency since January 2017 and added almost 7% to its performance after the hit on the 1.1980 support level. The GBP/USD pair recorded the second positive…
GOLD - USD
> Analyses
 Thank you
Reply
Chart
Thank you
Reply
Chart
Melina Deltas has published a new analysis.
- 98
- 836
- 1878
- 0
Timeframe : Weekly - Simple chart
The yellow metal is trying to cover some losses of the previous month and is completing another neutral to bullish week. On the weekly timeframe, the XAU/USD pair is moving higher since December of…
DOW JONES INDUSTRIAL AVERAGE > Analyses
 Thank you
Reply
Thank you
Reply
Melina Deltas has published a new analysis.
- 98
- 836
- 1878
- 0
Timeframe : Weekly - Simple chart
The Dow Jones Industrial Average index posted a fresh all-time high at 23621.50 during the previous weeks and soared more than 29% over the last year. The price posted the second bearish week in a row…
USD/CAD
> Analyses
 Thank you
Reply
Chart
Thank you
Reply
Chart
Melina Deltas has published a new analysis.
- 98
- 836
- 1878
- 0
Timeframe : Daily - Simple chart
The USD/CAD pair dropped sharply since the beginning of the month and we will not be surprised by the relief move to the upside. The commodity currency pair recorded two straight negative weeks,…
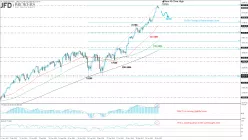
GBP/USD
> Analyses
 Thank you
Reply
Chart
Thank you
Reply
Chart
Melina Deltas has published a new analysis.
- 98
- 836
- 1878
- 0
Timeframe : Daily - Simple chart
The GBP/USD pair is posting the fifth bullish day in a row and is trying to expose above the strong resistance obstacle of 50-day SMA. The cable is still developing within a narrow range with upper…
EUR/USD
> Analyses
 Thank you
Reply
Chart
Thank you
Reply
Chart
Melina Deltas has published a new analysis.
- 98
- 836
- 1878
- 0
Timeframe : Daily - Simple chart
The single currency had a strong bullish rally against the greenback over the last trading days as it added, however, it failed to end the day above the 100-SMA and posted a neutral to bearish…

